
Figure 3
- ID
- ZDB-FIG-210512-51
- Publication
- Sofou et al., 2021 - Bi-allelic VPS16 variants limit HOPS/CORVET levels and cause a mucopolysaccharidosis-like disease
- Other Figures
- All Figure Page
- Back to All Figure Page
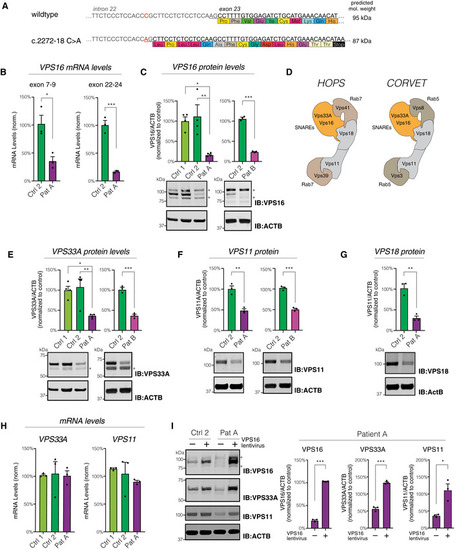
The c.2272‐18C>A variant generates a new splice‐acceptor sequence 16 base pairs upstream of the normal exon 23 border, resulting in a frameshift and premature stop codon. Levels of Quantifications of VPS16 in fibroblast lysates by immunoblotting. Representative immunoblots (bottom) and summary quantifications (top) of the levels of VPS16 in patient A ( Schematic illustration of HOPS and CORVET complexes showing their subunit compositions. The Rab5‐binding CORVET subunits VPS3 and VPS8 replace the Rab7‐binding VPS39 and VPS41 of HOPS. Models adapted from Bröcker et al ( Quantifications of HOPS/CORVET subunits in fibroblast lysates (top) and representative immunoblots (bottom), analyzed as in (C). (E) VPS33A, (F) VPS11, (G) VPS18. Analysis of Immunoblots (left) and quantifications normalized to control (right) of VPS16, VPS33A, and VPS11 in lysates from fibroblasts transduced with a lentivirus to express Data information: All immunoblots were acquired using fluorescent secondaries and pseudocolored to greyscale. Stars denote unspecific bands. All data were shown as mean ±SEM of 3–4 biological replicates. Statistical comparisons were made by two‐tailed unpaired Student’s |