
Figure 4
- ID
- ZDB-FIG-210512-53
- Publication
- Sofou et al., 2021 - Bi-allelic VPS16 variants limit HOPS/CORVET levels and cause a mucopolysaccharidosis-like disease
- Other Figures
- All Figure Page
- Back to All Figure Page
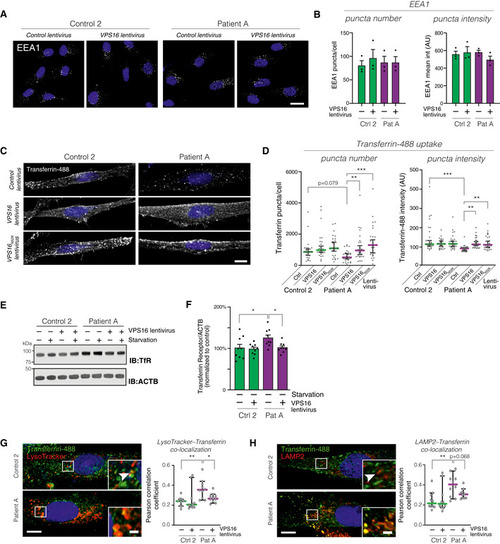
Analysis of the early endosome marker EEA1 in fibroblasts transduced with control or Analysis of transferrin uptake in fibroblasts transduced with the indicated lentiviruses. Representative confocal micrographs of fibroblasts fed with Alexa488‐conjugated Transferrin for 30 min. Scale bar, 10 μm. Quantifications of the number and fluorescence intensities of intracellular Transferrin puncta ( Immunoblot for Transferrin receptor (TfR) levels in the indicated fibroblasts under basal and serum‐starved conditions. Summary quantification of Transferrin receptor levels in non‐starved fibroblasts transduced with the indicated lentiviruses, normalized to actin (ACTB), and expressed as % of controls ( Analysis of intracellular Transferrin trafficking. Fibroblasts fed with fluorescently labeled Transferrin were co‐stained with LysoTracker (G) or an antibody against LAMP2 (H). Representative images (left) of fibroblasts transduced with control virus, with magnified areas demonstrating co‐localized puncta (arrowheads). Scale bars 10 μm or 2 μm (inserts). Quantifications (right) of the co‐localization between Transferrin and LysoTracker or LAMP2, respectively, expressed as Pearson correlation coefficients. Colored horizontal bars indicate the median values and whiskers 5 and 95 percentiles ( Data information: Bar graphs represent data as mean ±SEM. Statistical comparisons between the indicated groups by one‐way ANOVA with Holm–Sidak’s multiple comparisons tests. * |