
- Title
-
Optogenetic investigation of BMP target gene expression diversity
- Authors
- Rogers, K.W., ElGamacy, M., Jordan, B.M., Müller, P.
- Source
- Full text @ Elife
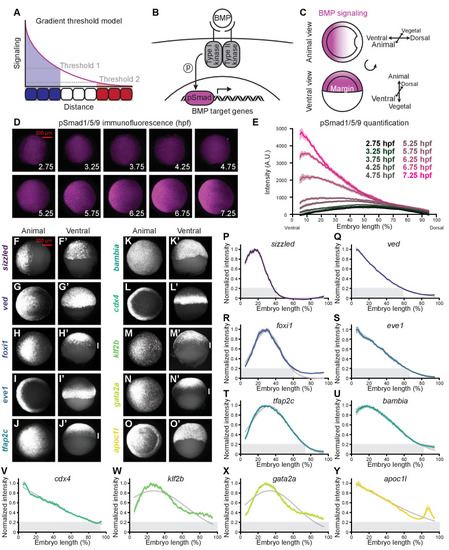
BMP target genes have diverse spatial expression patterns at shield stage. (A) The gradient threshold model states that a signaling gradient activates genes (blue, white, red) at different thresholds (dashed gray lines). (B) BMP binding induces receptor complex formation, phosphorylation of Smad1/5/9, and activation of target genes. (C) Schematic of shield-stage zebrafish embryos with BMP signaling gradients (magenta) along the dorsal-ventral axis. (D-E) Representative images (D) of pSmad1/5/9 immunofluorescence in embryos at the indicated time post-fertilization and quantification (E). (F-O’) Fluorescence in situ hybridization (FISH) showing spatial expression of the indicated high-confidence BMP target genes at shield stage (~6.75 h post-fertilization (hpf)). (F,G,H,I,J,K,L,M,N,O) are animal views, dorsal to the right. (F’,G’,H’,I’,J’,K’,L’,M’,N’,O’) are ventral views. Vertical white bars indicate regions where expression is excluded from the margin. (P-Y) Quantification of FISH signal along the dorsal-ventral axis for the indicated BMP target genes at shield stage (ventral on the left, dorsal on the right as in (E)). Normalized intensities are shown; error bars represent standard error. The Gaussian function Ae−(x−μ)2/ς was fitted to each profile (gray lines), and gene expression range was defined as r=μ+2√ς/2 (gray bars). Some BMP target genes could not be reliably quantified due to weak FISH signal (bmp4, id2a, smad6a, smad7, and znfl2b) or inability to reliably identify the ventral side in all assays (crabp2b). See the Figure 1—source data 1 file for source data. |
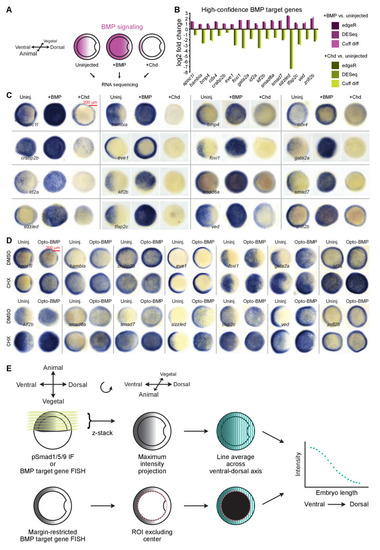
(A) Transcript levels in uninjected shield-stage (~6.75 hpf) embryos and siblings injected with 10 pg bmp2b or 100 pg chordin (Chd, BMP inhibitor) mRNA were assessed by RNA-sequencing (Supplementary file 1). (B) 16 high-confidence BMP target genes were both upregulated in bmp-overexpressing embryos and downregulated in chordin-overexpressing embryos. All RNA-seq data shown here is classified as significantly differentially regulated by edgeR, DESeq, and Cuff diff. (C) Embryos treated as in (A) were fixed at shield stage and BMP target gene expression assessed by in situ hybridization. (D) Opto-BMP (Figure 3—figure supplement 1A) and uninjected embryos were exposed to DMSO or 50 μg/ml of the translation inhibitor cycloheximide (CHX) at 6.25 hpf, illuminated with blue light from 6.75 to 7.25 hpf, and fixed 20 min post-exposure. A subset of BMP target genes was assessed by in situ hybridization. (E) Embryos were imaged using selective plane illumination microscopy to assess BMP signaling (pSmad1/5/9 immunofluorescence) or BMP target gene expression (fluorescence in situ hybridization). Average intensities along vertical lines from the ventral to dorsal side were calculated. ROIs excluded the embryo center for quantification of margin-restricted genes. See the Figure 1—figure supplement 1—source data 1 file for source data. |
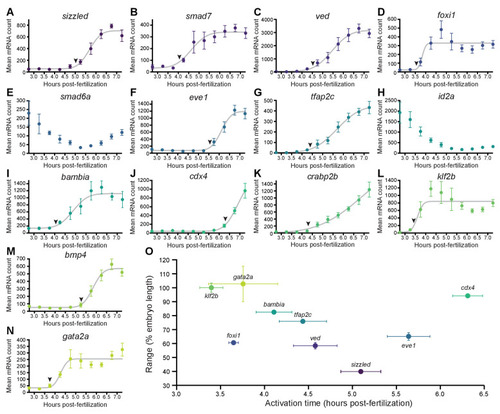
(A–N) Embryos were collected every 30 min from 2.75 to 7.25 hpf, and transcript levels were quantified using NanoString technology. Error bars represent standard error. Temporal profiles were fit with the cumulative distribution function of the normal distribution (gray lines), and activation time (arrowheads) was defined as the average time point at which the curves reached about two mean average deviations (i.e., 1.5∙τ) from the inflection point ν (excluding the maternally deposited genes id2a [Chong et al., 2005] and smad6a [White et al., 2017]). NanoString probes for two high-confidence activated BMP target genes (apoc1l and znfl2b) were not functional. (O) Average gene expression spatial range is plotted against average activation time. See the Figure 2—source data 1 file for source data. |

(A) Schematic of Opto-BMP strategy. Blue light-dimerizable VfLOV domains were fused to zebrafish BMP receptor kinase domains. Blue light exposure activates BMP signaling. (B) Embryos injected with mRNA encoding Opto-BMP at the one-cell stage and their uninjected siblings were reared in the dark or exposed to blue light for 10 h starting 70–80 min post-fertilization. Ventralization phenotypes V1-V4 (indicating excess BMP signaling) were scored at 1 day post-fertilization. Number of embryos: uninjected dark = 59, Opto-BMP dark = 53, uninjected light = 55, Opto-BMP light = 60. (C-E) Uninjected and Opto-BMP-injected embryos were exposed to blue light (2300 lux) for 30 min starting at high stage (3.5 hpf) or shield stage (6.75 hpf) and fixed during and after exposure. pSmad1/5/9 immunofluorescence was quantified and plotted in (C) as Opto-BMP minus uninjected signal with piecewise linear interpolation between timepoints; error bars represent standard error (see Materials and methods for statistical analysis). Blue background represents light exposure. Representative embryos from the high-stage (D) and shield-stage (E) experiments quantified in (C). pSmad1/5/9 signal is shown in magenta, DAPI in cyan. See the Figure 3—source data 1 file for source data. |
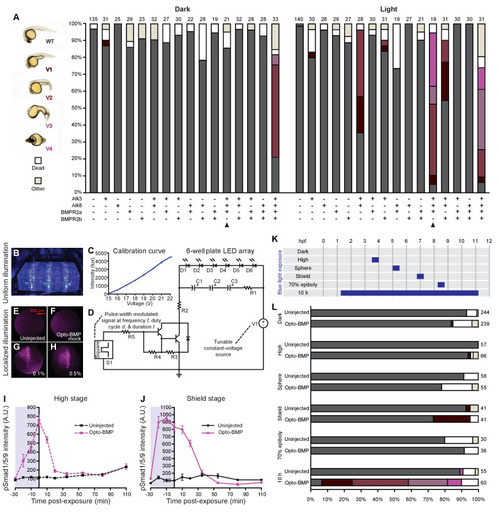
(A) Embryos injected with Opto-BMP-encoding mRNA at the one-cell stage were reared in the dark or exposed to white light, and phenotypes were scored at 1 day post-fertilization (dpf). Number of embryos analyzed is indicated on top of each bar. A combination of Opto-Alk3, Opto-Alk8, and Opto-BMPR2a (arrowheads) was used in subsequent experiments. Equimolar amounts of mRNA were injected: Opto-Alk3: 5.2 pg, Opto-Alk8: 5.2 pg, Opto-BMPR2a: 8.9 pg, Opto-BMPR2b: 5 pg. (B) Blue LEDs were embedded into the lid of a six-well dish. (C) LED intensity was measured three times with a luxmeter at different voltages. Averages are shown with piecewise linear interpolation; error bars represent standard error. (D) Circuit schematic for the LED array. A program-generated square wave on a single-board computer acts as a signal source (S1) controlling an amplifier to time the operation and intensity of an LED array (D1-6) run on a constant-voltage power supply (V1). S1: Square wave signal source. C1-3: 1000 μF, 10 V electrolytic capacitor, V1: Constant-voltage regulated power supply, D1-6: 470 nm blue light diode, R1: 200 Ω resistor, R2: 68 Ω, 2W choke resistor, R3: 70 Ω resistor, R4: 7 kΩ resistor, R5: 20 kΩ resistor. (E-H) Opto-BMP embryos were exposed to a 5–12 μm-thick sheet of 405 nm light at the indicated laser power for 3 min using SPIM. BMP signaling was assessed using pSmad1/5/9 immunofluorescence (animal views). Opto-BMP embryos exhibit localized BMP activation compared to uninjected (E) and mock-exposed Opto-BMP embryos (F). (I-J) Uninjected and Opto-BMP-injected embryos were exposed to blue light (2300 lux) for 30 min starting at high stage (3.5 hpf, I) or shield stage (6.75 hpf, J). pSmad1/5/9 immunofluorescence was quantified and plotted with piecewise linear interpolation between timepoints; error bars represent standard error (Materials and methods). Blue background represents light exposure. This data is shown in Figure 3C as Opto-BMP - uninjected intensity. (K) Uninjected and Opto-BMP embryos were reared in the dark or exposed transiently to blue light (2300 lux) for 30 min or 10 h at the indicated developmental stages. (L) Phenotypes were scored at 1 dpf; number of embryos analyzed is indicated to the right of each bar. See the Figure 3—figure supplement 1—source data 1 file for source data. |
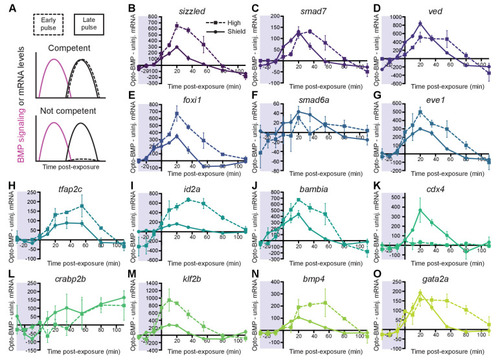
(A) Schematic of competence model: Late-activated genes should respond to a late (shield stage, solid line), but not early (high stage, dashed line) BMP signaling pulse. (B-O) High-confidence BMP target gene responses after an early (high stage,~3.5 hpf, dashed line) or late (shield stage,~6.75 hpf, solid line) BMP signaling pulse delivered by exposing uninjected and Opto-BMP-injected embryos to 30 min blue light (Figure 3C–E and Figure 3—figure supplement 1I,J). To assess induced transcription, NanoString transcript counts from uninjected embryos were subtracted from Opto-BMP transcript counts and are plotted here with piecewise linear interpolation between timepoints; error bars represent standard error (see Materials and methods for statistical analysis). See the Figure 4—source data 1 file for source data. |
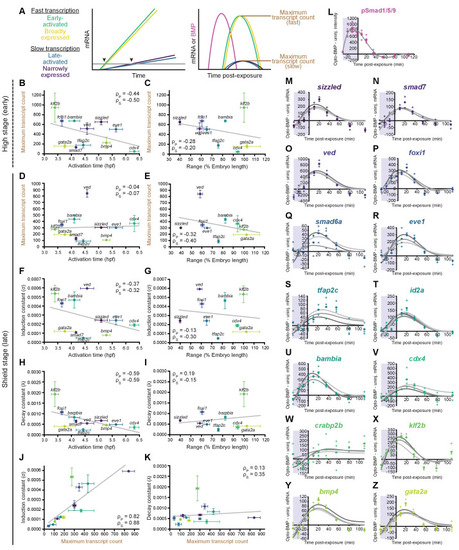
(A) Different transcription kinetics may lead to differences in apparent activation times (arrowheads) based on assay detection thresholds (gray line). Assuming similar degradation kinetics, transcripts with faster induction rates should accumulate to higher levels in response to BMP. (B-E) Uninjected and Opto-BMP-injected embryos were exposed to blue light for 30 min at high (~3.5 hpf, B,C) or shield stage (~6.75 hpf, D,E), and target gene expression in response to the resulting BMP signaling pulses (Figure 3C–E and Figure 3—figure supplement 1I,J) was quantified using NanoString technology (Figure 4). Maximum average transcript counts were determined, and are plotted against activation time (B,D) (Figure 2) or spatial range (C,E). Error bars represent standard error, gray lines represent linear fits, ρs = Spearman correlation coefficient, ρp = Pearson correlation coefficient. crabp2b is not included due to lack of significant induction. (F-L) All three target gene response repeats were fitted with a model of induction and decay (Materials and methods). The average induction constant (σ) is plotted against activation time (F), spatial range (G), or maximum transcript count (J). The average decay constant (λ) is plotted against activation time (H), range (I), or maximum transcript count (K). Error bars represent standard error, ρs = Spearman correlation coefficient, ρp = Pearson correlation coefficient. crabp2b is not included due to lack of significant induction. pSmad1/5/9 immunofluorescence (Figure 3) was fitted with a polynomial (gray line, L) and used as signaling input. (M-Z) Individual fits of transcriptional responses (Figure 4); closed circles represent averages of three data points, open circles represent individual data points, and gray lines represent individual fits of each repeat. See the Figure 5—source data 1 source data file for source data. |
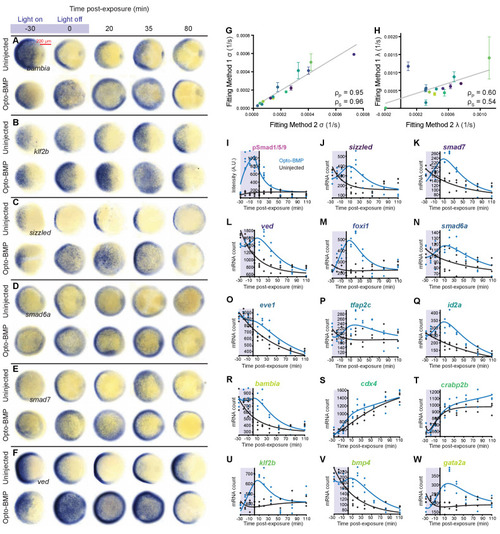
(A–F) Opto-BMP and uninjected embryos were exposed to blue light (2300 lux) for 30 min at shield stage (~6.75 hpf), and BMP target gene expression was assessed using colorimetric in situ hybridization in response to the BMP signaling pulse (Figure 3C and Figure 3—figure supplement 1J). Animal pole views. (G-H) Transcript levels in embryos treated as described in A-F were quantified using NanoString technology (Figure 4). BMP target gene induction (σ) and decay constants (λ) were determined by fitting the data using two approaches (Materials and methods): In Method 1 (main text and Figure 5), individual Opto-BMP – uninjected subtracted data series were fitted with a model of induction and decay for each transcript; in Method 2, all raw data points from the Opto-BMP and uninjected data sets were fitted simultaneously for each transcript. Both approaches produced similar σ (G) and λ (H) values (gray lines represent linear fits, ρs = Spearman correlation coefficient, ρp = Pearson correlation coefficient, Method one median shown). (I-W) In Method 2, pSmad1/5/9 immunofluorescence (Figure 3C and Figure 3—figure supplement 1J) was fitted with a model of induction and decay (gray line, I) and used as signaling input to model the transcript time series. Fits of uninjected (black) and Opto-BMP (blue) transcript data using Method two are shown in J-W. See the Figure 5—figure supplement 1—source data 1 file for source data. |
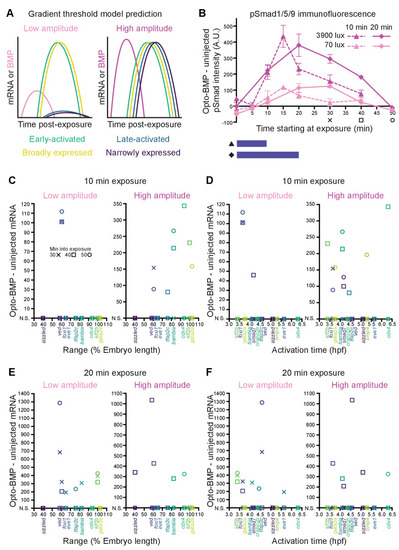
(A) The activation threshold model predicts that broadly expressed genes will be activated by lower amplitude signaling. (B) pSmad1/5/9 immunofluorescence in uninjected and Opto-BMP-injected embryos exposed to 10 (triangle, dashed line) or 20 (diamond, solid line) min of 70 (light pink) or 3900 (magenta) lux blue light starting at shield stage. Immunofluorescence was quantified and plotted as Opto-BMP signal - uninjected with piecewise linear interpolation between timepoints; error bars represent standard error (see Materials and methods for statistical analysis). Embryos for the transcriptional response experiment were collected 30 (x), 40 (square), or 50 (circle) min after the start of light exposure. (C-F) Transcriptional responses in Opto-BMP embryos exposed to conditions shown in (B) were quantified using NanoString technology and are plotted against spatial range (C,E) or activation time (D,F). Embryos were collected 30 (x), 40 (square), or 50 (circle) min after the start of light exposure. Responses that are not statistically significant are anchored to the x-axis (N.S.; see Materials and methods for statistical analysis). See the Figure 6—source data 1 file for source data. |
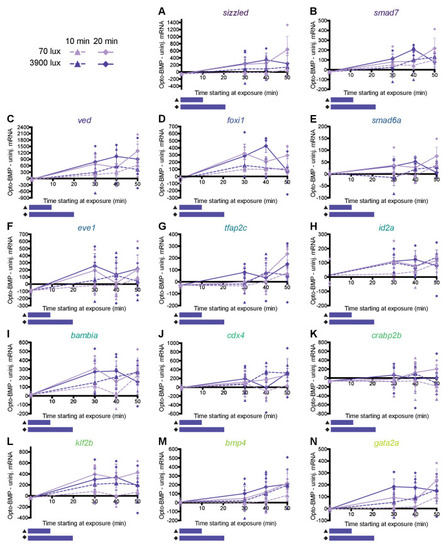
(A–N) High-confidence BMP target gene responses were measured in zebrafish embryos by NanoString technology after exposure to optogenetically generated BMP signaling pulses with different amplitudes and durations (see Figure 6B for BMP signaling pulse profiles). Uninjected and Opto-BMP-injected embryos were exposed to 10 (triangle, dashed line) or 20 (diamond, solid line) min of 70 (lilac) or 3900 (dark purple) lux blue light starting at shield stage (~6.75 hpf), and collected 30, 40, and 50 min after the beginning of light exposure. To assess induced transcription, average NanoString transcript counts from uninjected embryos were subtracted from Opto-BMP transcript counts and are plotted here with piecewise linear interpolation between timepoints; large symbols represent averages of three data points, small symbols represent individual data points, and error bars represent standard error (see Materials and methods for statistical analysis). See the Figure 6—source data 1 file for source data. |
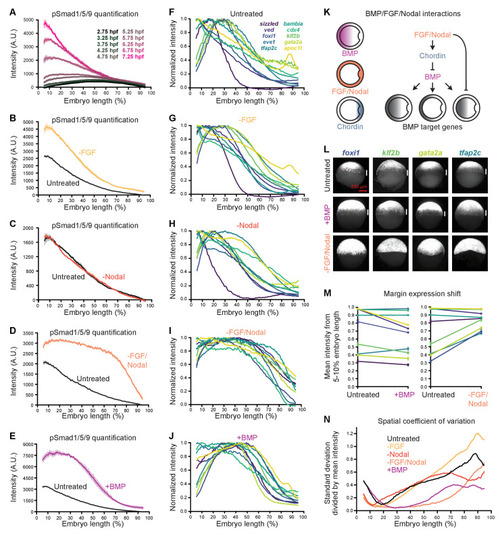
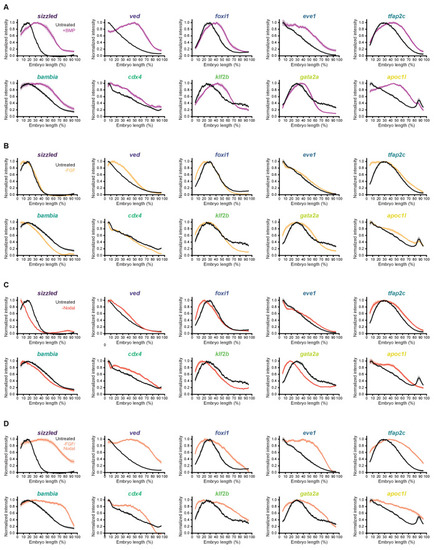
(A) pSmad1/5/9 immunofluorescence in untreated embryos at the indicated times (data also shown in Figure 1E). (B-E) Embryos were treated with 10 μM FGF inhibitor SU-5402 (B), 50 μM Nodal inhibitor SB-505124 (C), or both (D) starting at 2 hpf, or injected with 0.5 pg bmp2b mRNA at the one-cell stage (E). The BMP signaling gradient was quantified along the dorsal-ventral axis at shield stage using pSmad1/5/9 immunofluorescence; error bars represent standard error. Note that the embryos in panels B-E came from different experiments and were processed and imaged on different days, but untreated controls were always siblings of treated embryos and processed and imaged simultaneously. (F-J) BMP target gene expression along the dorsal-ventral axis at shield stage in untreated (F), SU-5402-treated (G), SB-505124-treated (H), SB-505124 + SU-5402-treated (I), and bmp-overexpressing (J) embryos quantified using fluorescence in situ hybridization (untreated data from Figure 1). (K) FGF and Nodal block expression of a subset of BMP target genes at the margin, and restrict BMP signaling in part by activating the BMP inhibitor Chordin. (L) Ventral views of margin-excluded BMP target gene expression at shield stage assessed by FISH in untreated embryos (top row), bmp-overexpressing embryos (0.5 pg bmp2b mRNA, middle row), and embryos treated with SU-5402 + SB-505124 (bottom row). Vertical white bars indicate regions where expression is excluded from the margin. (M) Expression levels at the margin quantified by calculating the average normalized intensity from 5–10% embryo length in untreated versus bmp-overexpressing embryos (left) or untreated versus SU-5402+SB-505124-treated embryos (right). Lines connect treated and untreated conditions to visualize shifts, error bars represent standard error. Lower numbers indicate less expression at the margin. (N) Spatial coefficient of variation for the 10 BMP target genes assessed here in untreated (black), SU-5402-treated (yellow), SB-505124-treated (red), SU-5402+SB-505124-treated (salmon), and bmp-overexpressing (magenta) embryos. Lower numbers indicate less spatial diversity. See the Figure 7—source data 1 file for source data. |
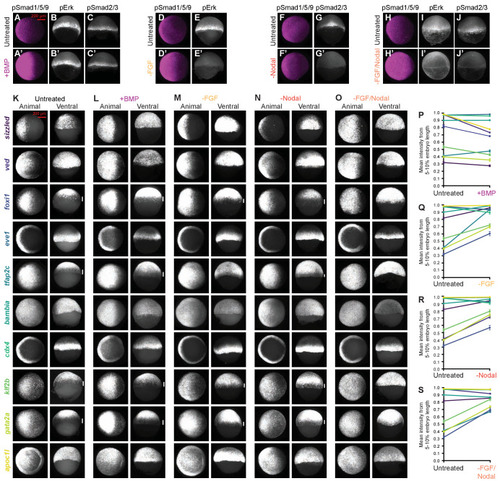
(A–J’) BMP, FGF, and Nodal signaling were assessed at shield stage (~6.75 hpf) using pSmad1/5/9, pErk, or pSmad2/3 immunofluorescence, respectively, in untreated embryos and siblings injected with 0.5 pg bmp2b mRNA (A-C’), or exposed to 10 μM FGF inhibitor SU-5402 (D-E’), 50 μM Nodal inhibitor SB-505124 (F-G’), or both (H-J’) starting at 2 h post-fertilization (hpf). pSmad1/5/9: animal views, pErk: lateral views, pSmad2/3: dorsal views. Quantification is shown in Figure 7B–E. (K-O) Fluorescence in situ hybridization for the indicated 10 high-confidence BMP target genes in shield-stage embryos treated as described in A-J’. Untreated images are also shown in Figure 1; Left columns are animal views (dorsal to the right), and right columns are ventral views. Vertical white bars indicate regions where expression is excluded from the margin. (P-S) Expression levels at the margin quantified by calculating the average normalized intensity from 5–10% embryo length in embryos treated as described in A-J’. P and S are also shown in Figure 7. Lines connect treated and untreated conditions to visualize shifts; error bars represent standard error. See the Figure 7—figure supplement 1—source data 1 file for source data. |
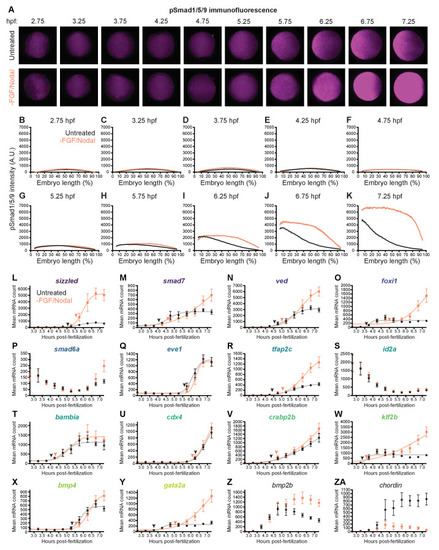
Embryos were treated with 10 μM FGF inhibitor SU-5402 and 50 μM Nodal inhibitor SB-505124 starting at 2 hpf. (A-K) BMP signaling was assessed from 2.75 to 7.25 h post-fertilization (hpf) in treated and untreated embryos using pSmad1/5/9 immunofluorescence. Spatial BMP signaling gradients along the ventral-to-dorsal axis were quantified (B-K). Error bars represent standard error; data from untreated embryos also shown in Figures 1E and 7A. (L-ZA) BMP target gene transcript levels (L-Y) were assessed using NanoString technology in embryos treated as described above from 2.75 to 7.25 hpf. Temporal profiles were fit with the cumulative distribution function of the normal distribution (gray and light salmon lines), and activation time (black arrowhead = untreated, salmon arrowhead = drug-treated) was defined as the average time point at which the curves reached about two mean average deviations (i.e., 1.5∙τ) from the inflection point ν (excluding the maternally deposited genes id2a [Chong et al., 2005] and smad6a [White et al., 2017]). Expression of bmp2b (Z) and chordin (ZA) was also assessed. Error bars represent standard error (see Materials and methods for statistical analysis). See the Figure 7—figure supplement 2—source data 1 file for source data. |
Spatial quantification of fluorescence in situ hybridization signal along the dorsal-ventral axis for BMP target genes at shield stage in embryos treated as indicated, compared to untreated spatial distributions (black). Normalized intensities are shown, error bars represent standard error. (A) Embryos were injected with 0.5 pg bmp2b mRNA at the one-cell stage. (B-D) Embryos were treated with 10 μM FGF inhibitor SU-5402 (B), 50 μM Nodal inhibitor SB-505124 (C), or both (D) starting at 2 hpf. See the Figure 7—figure supplement 3—source data 1 file for source data. |