
|
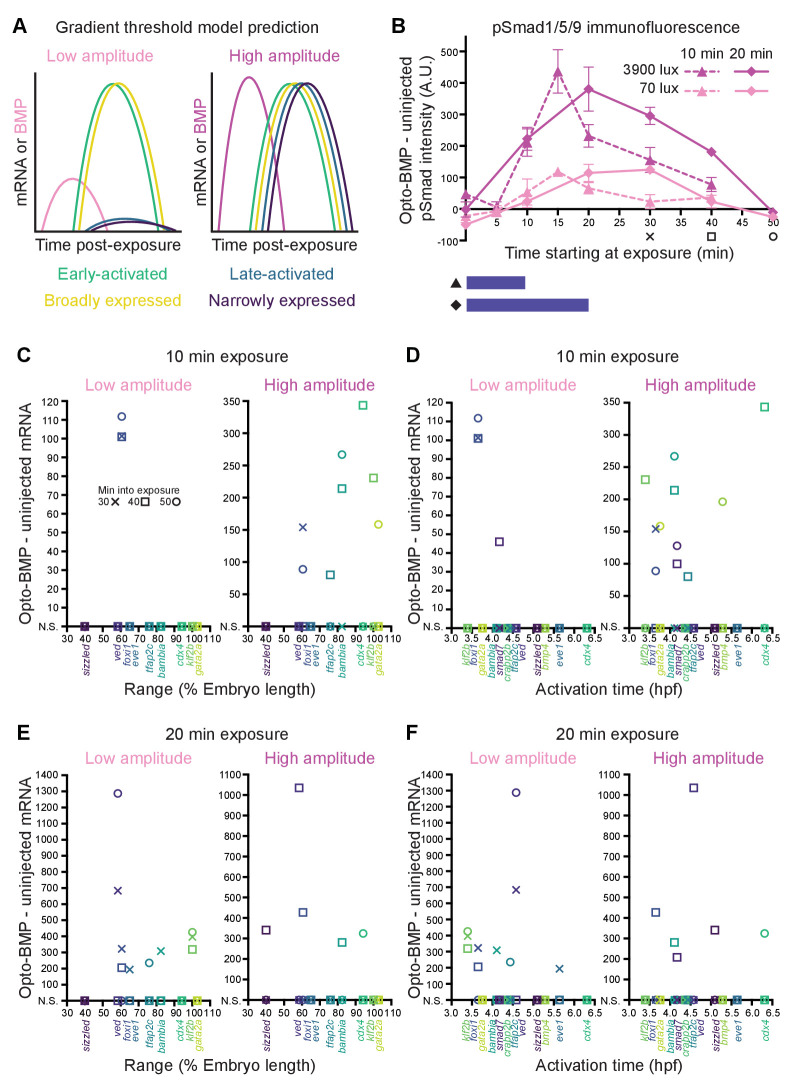
Figure 6 (A) The activation threshold model predicts that broadly expressed genes will be activated by lower amplitude signaling. (B) pSmad1/5/9 immunofluorescence in uninjected and Opto-BMP-injected embryos exposed to 10 (triangle, dashed line) or 20 (diamond, solid line) min of 70 (light pink) or 3900 (magenta) lux blue light starting at shield stage. Immunofluorescence was quantified and plotted as Opto-BMP signal - uninjected with piecewise linear interpolation between timepoints; error bars represent standard error (see Materials and methods for statistical analysis). Embryos for the transcriptional response experiment were collected 30 (x), 40 (square), or 50 (circle) min after the start of light exposure. (C-F) Transcriptional responses in Opto-BMP embryos exposed to conditions shown in (B) were quantified using NanoString technology and are plotted against spatial range (C,E) or activation time (D,F). Embryos were collected 30 (x), 40 (square), or 50 (circle) min after the start of light exposure. Responses that are not statistically significant are anchored to the x-axis (N.S.; see Materials and methods for statistical analysis). See the Figure 6—source data 1 file for source data.