
Figure 7—figure supplement 2
- ID
- ZDB-FIG-201216-40
- Publication
- Rogers et al., 2020 - Optogenetic investigation of BMP target gene expression diversity
- Other Figures
- All Figure Page
- Back to All Figure Page
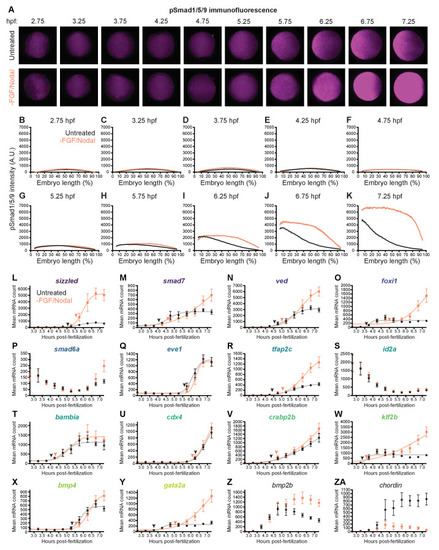
Embryos were treated with 10 μM FGF inhibitor SU-5402 and 50 μM Nodal inhibitor SB-505124 starting at 2 hpf. (A-K) BMP signaling was assessed from 2.75 to 7.25 h post-fertilization (hpf) in treated and untreated embryos using pSmad1/5/9 immunofluorescence. Spatial BMP signaling gradients along the ventral-to-dorsal axis were quantified (B-K). Error bars represent standard error; data from untreated embryos also shown in Figures 1E and 7A. (L-ZA) BMP target gene transcript levels (L-Y) were assessed using NanoString technology in embryos treated as described above from 2.75 to 7.25 hpf. Temporal profiles were fit with the cumulative distribution function of the normal distribution (gray and light salmon lines), and activation time (black arrowhead = untreated, salmon arrowhead = drug-treated) was defined as the average time point at which the curves reached about two mean average deviations (i.e., 1.5∙τ) from the inflection point ν (excluding the maternally deposited genes id2a [Chong et al., 2005] and smad6a [White et al., 2017]). Expression of bmp2b (Z) and chordin (ZA) was also assessed. Error bars represent standard error (see Materials and methods for statistical analysis). See the Figure 7—figure supplement 2—source data 1 file for source data. |