
Figure 7
- ID
- ZDB-FIG-201216-28
- Publication
- Rogers et al., 2020 - Optogenetic investigation of BMP target gene expression diversity
- Other Figures
- All Figure Page
- Back to All Figure Page
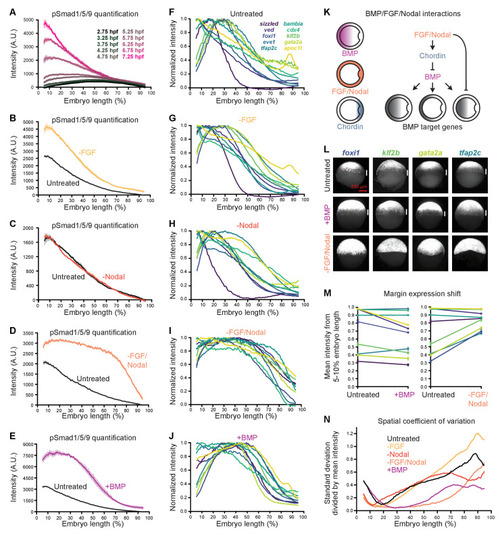
(A) pSmad1/5/9 immunofluorescence in untreated embryos at the indicated times (data also shown in Figure 1E). (B-E) Embryos were treated with 10 μM FGF inhibitor SU-5402 (B), 50 μM Nodal inhibitor SB-505124 (C), or both (D) starting at 2 hpf, or injected with 0.5 pg bmp2b mRNA at the one-cell stage (E). The BMP signaling gradient was quantified along the dorsal-ventral axis at shield stage using pSmad1/5/9 immunofluorescence; error bars represent standard error. Note that the embryos in panels B-E came from different experiments and were processed and imaged on different days, but untreated controls were always siblings of treated embryos and processed and imaged simultaneously. (F-J) BMP target gene expression along the dorsal-ventral axis at shield stage in untreated (F), SU-5402-treated (G), SB-505124-treated (H), SB-505124 + SU-5402-treated (I), and bmp-overexpressing (J) embryos quantified using fluorescence in situ hybridization (untreated data from Figure 1). (K) FGF and Nodal block expression of a subset of BMP target genes at the margin, and restrict BMP signaling in part by activating the BMP inhibitor Chordin. (L) Ventral views of margin-excluded BMP target gene expression at shield stage assessed by FISH in untreated embryos (top row), bmp-overexpressing embryos (0.5 pg bmp2b mRNA, middle row), and embryos treated with SU-5402 + SB-505124 (bottom row). Vertical white bars indicate regions where expression is excluded from the margin. (M) Expression levels at the margin quantified by calculating the average normalized intensity from 5–10% embryo length in untreated versus bmp-overexpressing embryos (left) or untreated versus SU-5402+SB-505124-treated embryos (right). Lines connect treated and untreated conditions to visualize shifts, error bars represent standard error. Lower numbers indicate less expression at the margin. (N) Spatial coefficient of variation for the 10 BMP target genes assessed here in untreated (black), SU-5402-treated (yellow), SB-505124-treated (red), SU-5402+SB-505124-treated (salmon), and bmp-overexpressing (magenta) embryos. Lower numbers indicate less spatial diversity. See the Figure 7—source data 1 file for source data. |