
Figure 7—figure supplement 1
- ID
- ZDB-FIG-201216-39
- Publication
- Rogers et al., 2020 - Optogenetic investigation of BMP target gene expression diversity
- Other Figures
- All Figure Page
- Back to All Figure Page
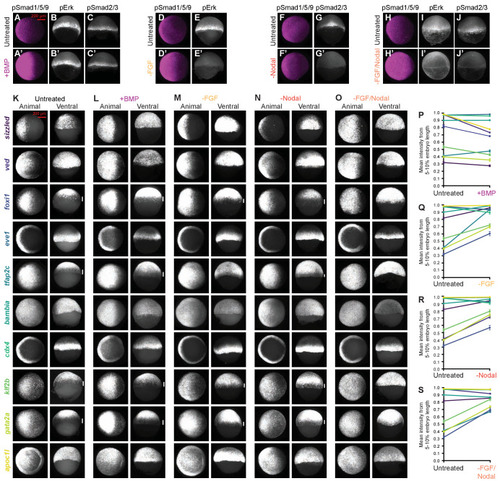
(A–J’) BMP, FGF, and Nodal signaling were assessed at shield stage (~6.75 hpf) using pSmad1/5/9, pErk, or pSmad2/3 immunofluorescence, respectively, in untreated embryos and siblings injected with 0.5 pg bmp2b mRNA (A-C’), or exposed to 10 μM FGF inhibitor SU-5402 (D-E’), 50 μM Nodal inhibitor SB-505124 (F-G’), or both (H-J’) starting at 2 h post-fertilization (hpf). pSmad1/5/9: animal views, pErk: lateral views, pSmad2/3: dorsal views. Quantification is shown in Figure 7B–E. (K-O) Fluorescence in situ hybridization for the indicated 10 high-confidence BMP target genes in shield-stage embryos treated as described in A-J’. Untreated images are also shown in Figure 1; Left columns are animal views (dorsal to the right), and right columns are ventral views. Vertical white bars indicate regions where expression is excluded from the margin. (P-S) Expression levels at the margin quantified by calculating the average normalized intensity from 5–10% embryo length in embryos treated as described in A-J’. P and S are also shown in Figure 7. Lines connect treated and untreated conditions to visualize shifts; error bars represent standard error. See the Figure 7—figure supplement 1—source data 1 file for source data. |