
Figure 6—figure supplement 1.
- ID
- ZDB-FIG-201216-38
- Publication
- Rogers et al., 2020 - Optogenetic investigation of BMP target gene expression diversity
- Other Figures
- All Figure Page
- Back to All Figure Page
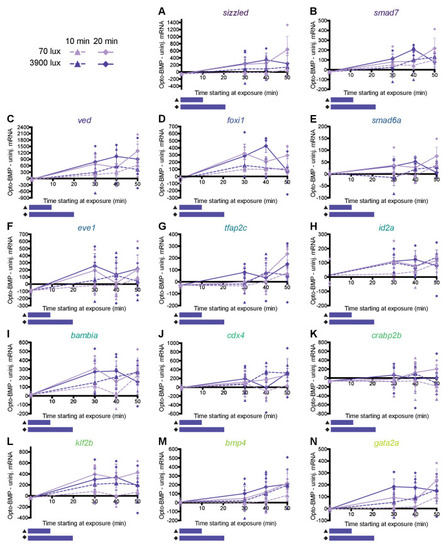
(A–N) High-confidence BMP target gene responses were measured in zebrafish embryos by NanoString technology after exposure to optogenetically generated BMP signaling pulses with different amplitudes and durations (see Figure 6B for BMP signaling pulse profiles). Uninjected and Opto-BMP-injected embryos were exposed to 10 (triangle, dashed line) or 20 (diamond, solid line) min of 70 (lilac) or 3900 (dark purple) lux blue light starting at shield stage (~6.75 hpf), and collected 30, 40, and 50 min after the beginning of light exposure. To assess induced transcription, average NanoString transcript counts from uninjected embryos were subtracted from Opto-BMP transcript counts and are plotted here with piecewise linear interpolation between timepoints; large symbols represent averages of three data points, small symbols represent individual data points, and error bars represent standard error (see Materials and methods for statistical analysis). See the Figure 6—source data 1 file for source data. |