
Figure 1—figure supplement 1
- ID
- ZDB-FIG-201216-30
- Publication
- Rogers et al., 2020 - Optogenetic investigation of BMP target gene expression diversity
- Other Figures
- All Figure Page
- Back to All Figure Page
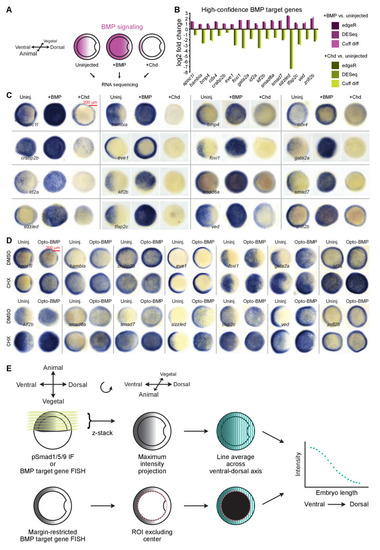
(A) Transcript levels in uninjected shield-stage (~6.75 hpf) embryos and siblings injected with 10 pg bmp2b or 100 pg chordin (Chd, BMP inhibitor) mRNA were assessed by RNA-sequencing (Supplementary file 1). (B) 16 high-confidence BMP target genes were both upregulated in bmp-overexpressing embryos and downregulated in chordin-overexpressing embryos. All RNA-seq data shown here is classified as significantly differentially regulated by edgeR, DESeq, and Cuff diff. (C) Embryos treated as in (A) were fixed at shield stage and BMP target gene expression assessed by in situ hybridization. (D) Opto-BMP (Figure 3—figure supplement 1A) and uninjected embryos were exposed to DMSO or 50 μg/ml of the translation inhibitor cycloheximide (CHX) at 6.25 hpf, illuminated with blue light from 6.75 to 7.25 hpf, and fixed 20 min post-exposure. A subset of BMP target genes was assessed by in situ hybridization. (E) Embryos were imaged using selective plane illumination microscopy to assess BMP signaling (pSmad1/5/9 immunofluorescence) or BMP target gene expression (fluorescence in situ hybridization). Average intensities along vertical lines from the ventral to dorsal side were calculated. ROIs excluded the embryo center for quantification of margin-restricted genes. See the Figure 1—figure supplement 1—source data 1 file for source data. |