
- Title
-
Hmx3a Has Essential Functions in Zebrafish Spinal Cord, Ear and Lateral Line Development
- Authors
- England, S.J., Cerda, G.A., Kowalchuk, A., Sorice, T., Grieb, G., Lewis, K.E.
- Source
- Full text @ Genetics
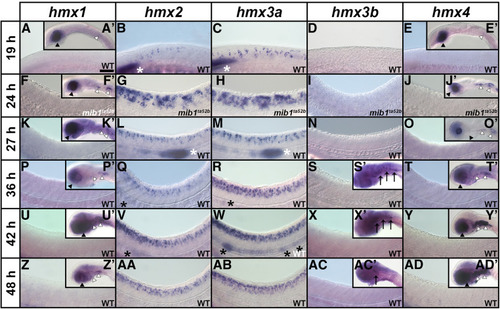
Expression of EXPRESSION / LABELING:
|
EXPRESSION / LABELING:
|
EXPRESSION / LABELING:
PHENOTYPE:
|
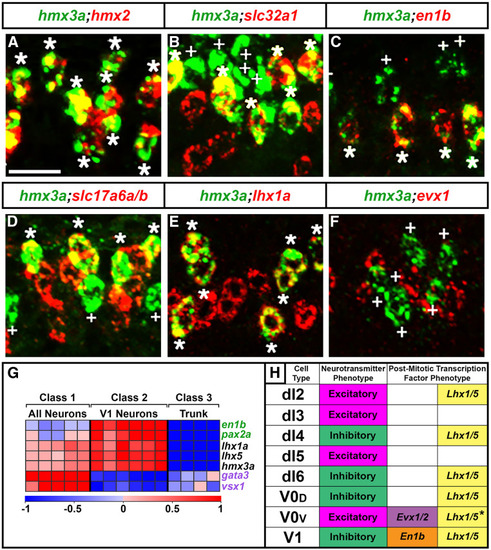
Summary of |
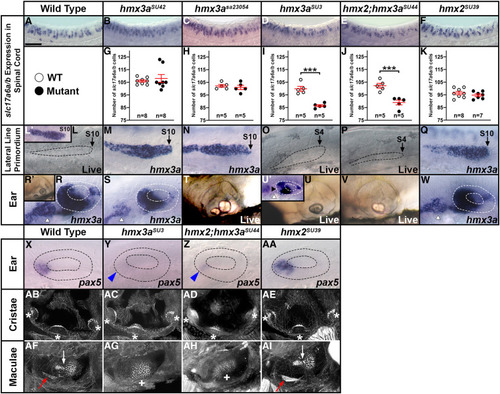
Only some |
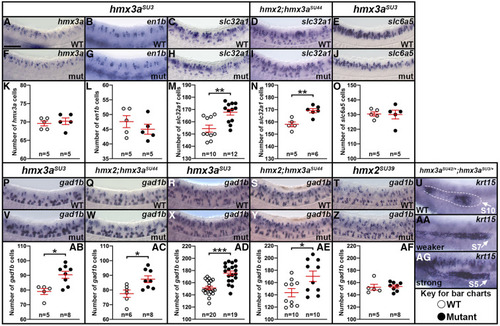
Analysis of |
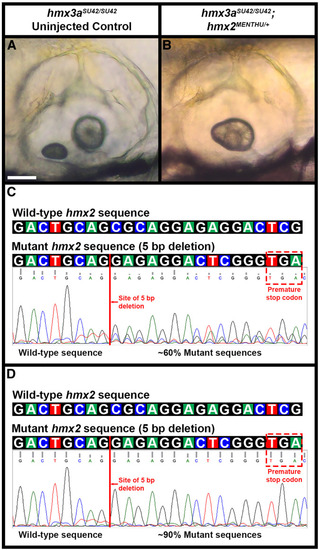
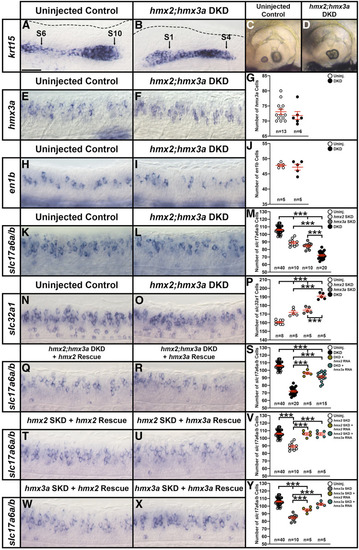
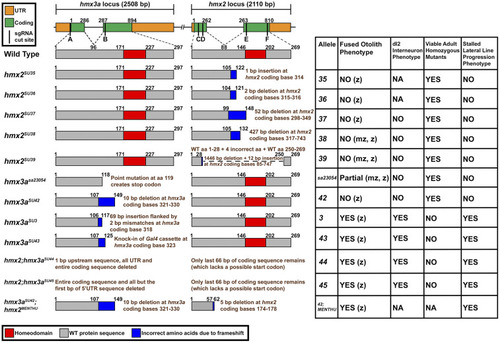
Phenotypic and genotypic analysis of embryos from an incross of PHENOTYPE:
|
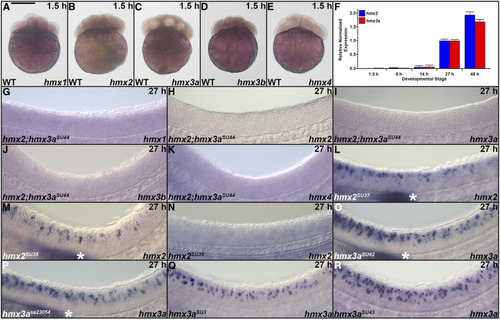
Expression of |