Figure Caption
Figure 6
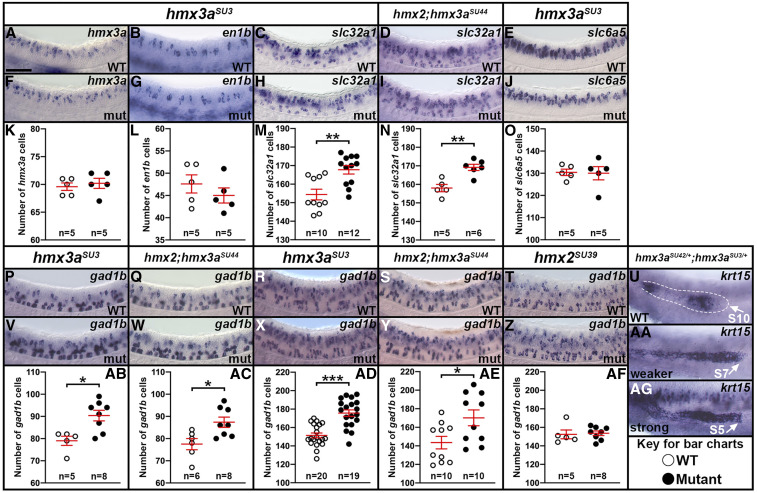
Analysis of hmx3a single and hmx2;hmx3a deletion mutants. (A–J, P–AA, and AG) Lateral views of hmx3a (A and F), en1b (B and G), slc32a1 (C, D, H, and I), slc6a5 (E and J), gad1b (P–T, V–Z), or krt15 (U, AA, and AG) expression in spinal cord (A–J, P–T, V–Z) or lateral line primordium (U, AA, and AG) at 27 hpf (A–J, P, Q, U–W, AA, and AG) or 48 hpf (R–T, X–Z). Rostral, left; Dorsal, up. (K–O, AB–AF). Number of cells expressing hmx3a (K), en1b (L), slc32a1 (M and N), slc6a5 (O), and gad1b (AB–AF) in a precisely defined spinal cord region adjacent to somites 6-10 at 27 hpf (K–O, AB, and AC) or 48 hpf (AD–AF). Data are depicted as individual value plots and the n-values for each genotype are also shown. For each plot, the wider red horizontal bar depicts the mean number of cells and the red vertical bar depicts the SEM (SEM values are listed in Table 2). All counts are an average of at least five embryos. Statistically significant (P < 0.05) comparisons are indicated with brackets and asterisks. * P < 0.05, ** P < 0.01, *** P < 0.001. White circles indicate WT data and black circles the appropriate mutant data as indicated in key under panel AG. All data were first analyzed for normality using the Shapiro–Wilk test. Data sets in M, AB and AF are nonnormally distributed and were analyzed with the Wilcoxon–Mann–Whitney test. Data sets in K, L, N, O, AC, AD, and AE are normally distributed and so the F-test for equal variances was performed. All of these had equal variances, so a type 2 Student’s t-test was performed. P-values are provided in Table 2. (A, B, F, G, K, and L) As in DKD embryos (Figure 3), dI2 and V1 interneurons do not die, nor do dI2 interneurons transfate/change into V1 interneurons in hmx3aSU3 mutant embryos, since the numbers of hmx3a- (A, F and K) and en1b-expressing cells (B, G and L) do not change compared to WT embryos. There is a statistically significant increase in the number of inhibitory, slc32a1-expressing cells in hmx3aSU3 mutants (C, H, and M) and hmx2;hmx3aSU44 mutants (D, I, and N) compared to WT embryos. However, at 27 hpf, the number of slc6a5-expressing cells is unchanged between WT and hmx3aSU3 mutants (E, J and O), whereas there is an increase in the number of GABAergic (gad1b-positive) cells in hmx3aSU3 (P, V, and AB) and hmx2;hmx3aSU44 mutants (Q, W, and AC), suggesting that the additional inhibitory cells in the mutant embryos are GABAergic and not glycinergic. (R, S, X, Y, AD, and AE) There is an equivalent increase in GABAergic (gad1b-positive) cells at 48 hpf in hmx3aSU3 and hmx2;hmx3aSU44 mutant embryos. However, there is no change in the number of GABAergic (gad1b-positive) cells at 48 hpf in hmx2SU39 mutants, compared to WT embryos (T, Z, and AF). (U, AA, and AG). hmx3aSU42/+;hmx3aSU3/+trans-het embryos have two different lateral line primordium progression phenotypes at 27 hpf. Bar, 50 µm.
Acknowledgments
This image is the copyrighted work of the attributed author or publisher, and
ZFIN has permission only to display this image to its users.
Additional permissions should be obtained from the applicable author or publisher of the image.
Full text @ Genetics