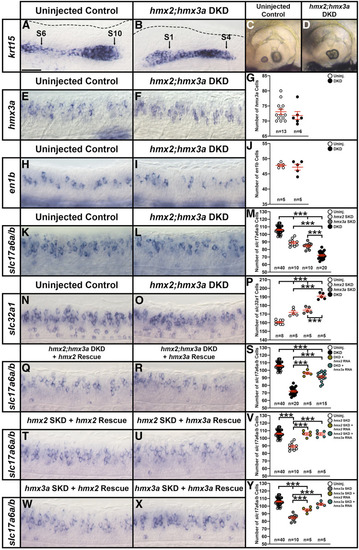
hmx2;hmx3a double knockdown (DKD) embryos have fewer excitatory (glutamatergic) and more inhibitory spinal cord interneurons. (A–D, E, F, H, I, K, L, N, O, Q, R, T, U, W, X) Lateral views of (A, B, E, F, H, I, K, L, N, O, Q, R, T, U, W, X) spinal cord at 27 hpf and (C and D) otic vesicles at 3 d. Rostral, left; Dorsal, up. (G, J, M, P, S, V, Y) Mean number of cells expressing hmx3a (G), en1b (J), slc17a6a/b (M, S, V, Y), and slc32a1 (P) in a precisely defined spinal cord region adjacent to somites 6–10 at 27 hpf. All counts are an average of at least five embryos. Data are depicted as individual value plots and the n-values for each genotype are also shown. For each plot, the wider red horizontal bar depicts the mean number of cells and the red vertical bar depicts the SEM (SEM values are listed in Table 1). Statistically significant (P < 0.001) comparisons are indicated with brackets and three asterisks. All data were first analyzed for normality using the Shapiro–Wilk test. Data set in G is nonnormally distributed and was, therefore, analyzed with the Wilcoxon–Mann–Whitney test. Data sets in J, M, P, S, V, and Y are normally distributed and so, for the pairwise comparison shown in J, the F-test for equal variances was performed. This data set has equal variances and so a type 2 (for equal variances) Student’s t-test was performed. To accurately compare the four different data sets each shown in panel M, P, S, V, and Y, a one-way ANOVA test was performed. All data sets for ANOVA analysis have both normal distributions and homogeneous (homoscedastic, Bartlett’s test P > 0.05) variances and so standard ANOVA analysis was performed. All ANOVA analyses shown are significant [M: ANOVA F(3,76) = 231.5, P ≤ 0.0001; P: ANOVA F(3,19) = 80.64, P ≤ 0.0001; S: ANOVA F(3,76) = 196.3, P ≤ 0.0001; V: ANOVA F(3,56) = 34.97, P ≤ 0.0001; and Y: ANOVA F(3,56) = 61.14, P ≤ 0.0001], and so to determine which specific experimental group or groups differed, Tukey’s honestly significant difference post hoc test for multiple comparisons was performed. Mean numbers of cells and P-values are provided in Table 1. In some cases, cell count data were pooled from different experiments (uninjected control data in M, S, V, and Y from 12 pooled experiments, hmx2;hmx3a DKD data in M and S from 4 pooled experiments, hmx2 SKD data in M and V from 2 pooled experiments, and hmx3a SKD data in M and Y from 2 pooled experiments). As in situ hybridization staining can vary slightly between experiments, we only pooled data from different experiments, or compared different morpholino injection experiments if pairwise comparisons of the counts from corresponding uninjected WT control embryos were not statistically significantly different from each other. (A and B) By 27 hpf, in an uninjected WT control embryo krt15 mRNA expression shows that the lateral line primordium (LLP) has migrated to its expected position over somite 10 (S10 + black arrow) (A). In contrast, at 27 hpf in hmx2;hmx3a DKD embryos, the LLP is stalled beside somites 1-4 (S1, S4, black arrows, B). This is identical to the stalled LLP phenotype observed in hmx3aSU3 and hmx2;hmx3aSU44 mutants (see Figure 5, O and P). Dotted line indicates dorsal spinal cord boundary in A and dorsal posterior hindbrain and anterior spinal cord boundary in B. (C and D) Also like hmx3aSU3 and hmx2;hmx3aSU44 mutants (see Figure 5, U and V), hmx2;hmx3a DKD embryos have fused otoliths at 3 d (D), but uninjected controls have not (C). (E–J) There is no change in the number of hmx3a- or en1b-expressing spinal cells in hmx2;hmx3a DKD compared to uninjected control embryos, suggesting that V1 and dI2 interneurons do not die or transfate/change into different cell types. (K–M) The number of slc17a6a/b-expressing (excitatory) spinal cells is reduced in both double and single knockdown (SKD) embryos, with the reduction being more severe in DKD embryos. (N–P) Concomitantly, there is a statistically significant increase in the number of slc32a1-expressing (inhibitory) cells in both SKD and DKD embryos, with the increase being more profound in DKD embryos. (Q–S) Injection of either morpholino-resistant hmx2 (Q) or hmx3a mRNA (R) partially rescues the number of spinal excitatory cells in DKD embryos. (T–V) Injection of either morpholino-resistant hmx2 (T) or hmx3a mRNA (U) fully rescues the number of spinal excitatory cells in hmx2 SKD embryos. (W–Y) Injection of morpholino-resistant hmx2 mRNA (W) partially rescues the number of spinal excitatory cells in hmx3a SKD embryos, but injection of morpholino-resistant hmx3a mRNA (X) fully rescues the phenotype. Bar, 30 µm (A, B, E, F, H, I, K, L, N, O, Q, R, T, U, W, and X); 80 µm (C and D).
|
