
- Title
-
SLC20A1 Is Involved in Urinary Tract and Urorectal Development
- Authors
- Rieke, J.M., Zhang, R., Braun, D., Yilmaz, Ö., Japp, A.S., Lopes, F.M., Pleschka, M., Hilger, A.C., Schneider, S., Newman, W.G., Beaman, G.M., Nordenskjöld, A., Ebert, A.K., Promm, M., Rösch, W.H., Stein, R., Hirsch, K., Schäfer, F.M., Schmiedeke, E., Boemers, T.M., Lacher, M., Kluth, D., Gosemann, J.H., Anderberg, M., Barker, G., Holmdahl, G., Läckgren, G., Keene, D., Cervellione, R.M., Giorgio, E., Di Grazia, M., Feitz, W.F.J., Marcelis, C.L.M., Van Rooij, I.A.L.M., Bökenkamp, A., Beckers, G.M.A., Keegan, C.E., Sharma, A., Dakal, T.C., Wittler, L., Grote, P., Zwink, N., Jenetzky, E., Brusco, A., Thiele, H., Ludwig, M., Schweizer, U., Woolf, A.S., Odermatt, B., Reutter, H.
- Source
- Full text @ Front Cell Dev Biol

ZFIN is incorporating published figure images and captions as part of an ongoing project. Figures from some publications have not yet been curated, or are not available for display because of copyright restrictions. EXPRESSION / LABELING:
|
|
ZFIN is incorporating published figure images and captions as part of an ongoing project. Figures from some publications have not yet been curated, or are not available for display because of copyright restrictions. EXPRESSION / LABELING:
|
|
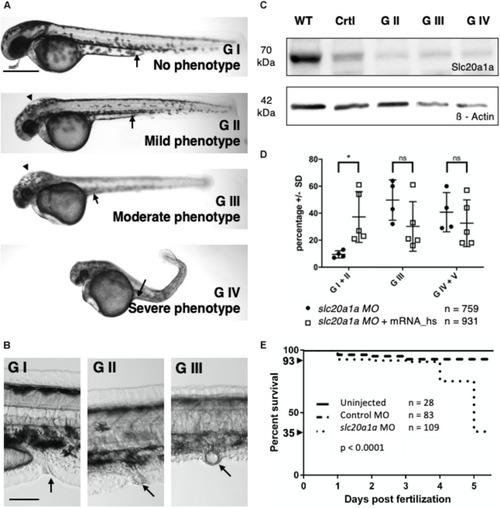
ZFIN is incorporating published figure images and captions as part of an ongoing project. Figures from some publications have not yet been curated, or are not available for display because of copyright restrictions. PHENOTYPE:
|
|
ZFIN is incorporating published figure images and captions as part of an ongoing project. Figures from some publications have not yet been curated, or are not available for display because of copyright restrictions. PHENOTYPE:
|
|
ZFIN is incorporating published figure images and captions as part of an ongoing project. Figures from some publications have not yet been curated, or are not available for display because of copyright restrictions. |
|
ZFIN is incorporating published figure images and captions as part of an ongoing project. Figures from some publications have not yet been curated, or are not available for display because of copyright restrictions. |
|
ZFIN is incorporating published figure images and captions as part of an ongoing project. Figures from some publications have not yet been curated, or are not available for display because of copyright restrictions. PHENOTYPE:
|
|
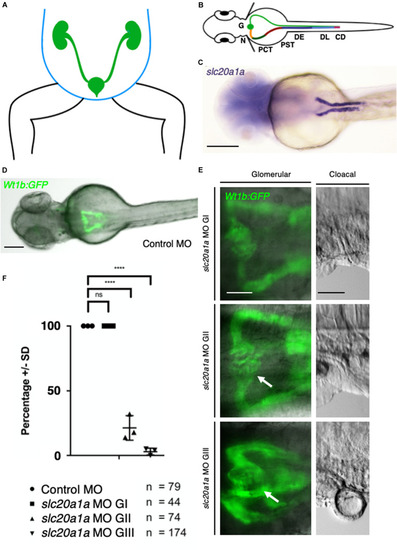
Pronephric cysts in |
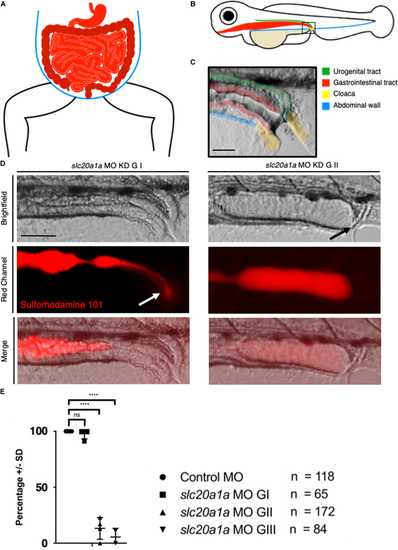
Sulforhodamine 101 excretion assay shows imperforate hindgut in PHENOTYPE:
|
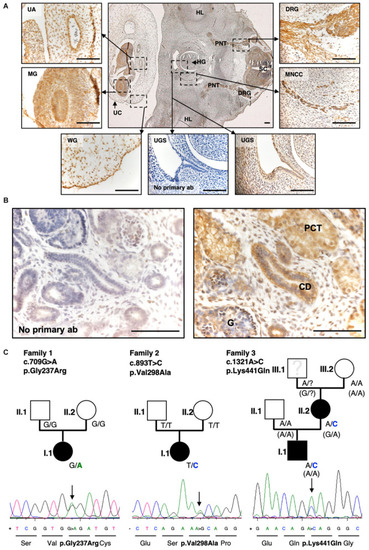
Exome sequencing and targeted Resequencing in families with BEEC phenotype identified disease variants in |
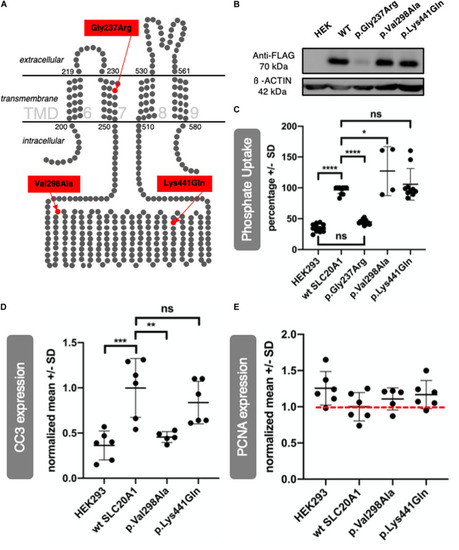
SLC20A1 as transmembrane phosphate transporter and |