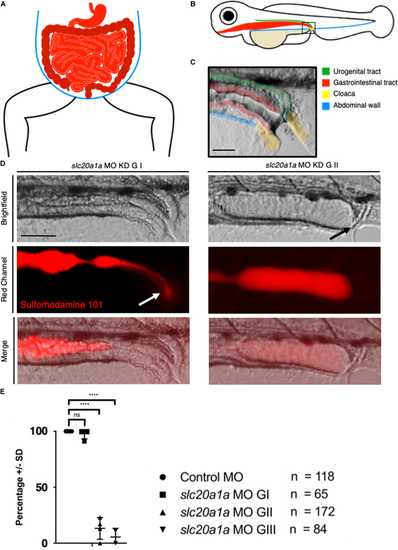
Sulforhodamine 101 excretion assay shows imperforate hindgut in slc20a1a MO KD zfl. (A) Scheme of human abdomen, red = GIT with stomach, duodenum, jejunum, ileum in light red and colon, rectum, anus in dark red; blue = abdominal wall. (B) Scheme of zfl, lateral view at 5 dpf; green = urogenital tract ((pronephros), red = GIT, blue = abdominal wall, beige = yolk sac, yellow = cloaca. (C) Cloaca in zfl at 5 dpf: fusion and opening of pronephros and GIT at cloaca between 4 and 5 dpf. Pseudocolored for identification as above in B: green = urogenital tract (pronephros), red = GIT, yellow = cloaca. Scale bar: 50 μm. (D) Opening of cloaca and excretion of SR101, a red fluorescent dye labeling the content of zfl intestine. Upper panel shows brightfield, middle panel red channel, lower panel shows a merged view of both channels. On the left we show slc20a1a MO KD G I zfl at 5 dpf compared to slc20a1a MO KD G II zfl at 5 dpf on the right side of the panel. In control MO and slc20a1a MO GI, zfl dye uptake is not disturbed; we could detect clear and bright red dye fluorescence in the gut of all animals. Dye excretion and opening of the cloaca was not disturbed. White arrow marks dye excretion from the cloaca. In contrary, we observed cloacal opening and excretion defects in slc20a1a MO KD G II zfl at 5 dpf mimicking an imperforate anus as shown on the right side of the panel. Black arrow marks opening defect and therefore resulting dilatation of intestine due to bag log. No changes in peristalsis of the GIT was observed; hence, expansion of distal part of intestine as shown here is solely caused by lack of cloacal opening. Scale bar: 50 μm. (E) Significant differences in opening of cloaca at 5 dpf in zfl between phenotypically affected and control MO. Cloacal opening was monitored for several minutes up to 1 h. Only 13.25% of G II and 5.5% of G III zfl showed cloacal opening and therefore excretion of SR101 from the GIT, whereas 82.5% of G II and 74% of G III zfl did not show any excretion. In the remaining 4.25% of G II and 20.5% of G III, zfl cloacal opening could not be assessed resulting from failure of SR101 uptake in the first place or misshape and tissue malformations not allowing to assess the cloacal region in the respective zfl. N = 4, ****p < 0.0001. Error bars show SD.)
|
