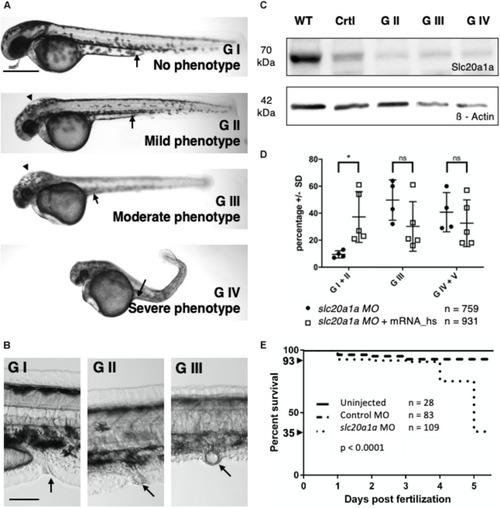
slc20a1a MO KD. KD was performed by injecting 0.75 ng of ATG-blocking MO into one-cell-staged wt zf eggs. Lateral view, dorsal to top, cranial on the left. (A) Phenotypical grading of MO injected zfl at 2 dpf in four grades increasing in severity and lethality. Scale bar: 500 μm. See main Results text for grading details. In brief, GI were normal in direct inspection; GII had mild defects; GIII had moderate defects, and GIV had severe defects. G V resembles dead zfl. Supplementary Data Sheet S3 shows close-ups for better demonstration of hydrocephalus and eye development in all four grades presented. (B) Examples for cloacal abnormalities in MO KD zfl at 2 dpf. Scale bar: 100 μm. Inspection of cloacal region after previous grading revealed malformations in cloacal region in G II and G III sorted zfl increasing in amount and severity with grading. G I sorted zfl had normal cloacal morphology, that is, a thin and curved organ with a distal opening (arrow). GII and GIII zfl have abnormally shaped cloacae, with dilated and/or apparently blind-ending lumens. Further cloacal close-ups of G II and III sorted zfl are shown in Supplementary Data Sheet S4. (C) WB shows efficacy of MO KD in zebrafish protein lysates from 2 dpf. 70 kDa: slc20a1a, 42 kDa: ß-Actin loading control; WT = uninjected control, Crtl = control MO injected, G II/III/IV = slc20a1a MO KD zfl sorted by grading II–IV. Slc20a1a can be detected in uninjected wt control and injected control MO group. Only a weak slc20a1a signal was seen in MO KD groups G II, III, and IV, which showed phenotypical features as described in (A). WB shows correlation between phenotype and protein expression. Raw data of WB is shown in Supplementary Data Sheet S6. (D) Co-injection of slc20a1a MO with 35 μg in vitro transcribed human SLC20A1 polyA mRNA shows partial rescue of various phenotypes underlining the Morpholino’s specificity. n = 5 (here n = 1 represents the average score in each experimental batch). Error bars show SD. X-axis shows groups at 3 dpf that were compared: zfl showing no or only a very mild phenotype (G I + G II), larvae with a moderate phenotype (G III) and a last group of larvae with a severe and lethal phenotype (G IV) together with those who were already dead at time of comparison (G V). Y-axis shows the percentage of zfl in the corresponding groups described before. A significant difference (∗p = 0.01) was seen within the first group of MO and MO-mRNA rescue group, showing a partial rescue of slc20a1a MO KD phenotype reflected in bigger group of phenotypically not or only mildly affected zfl. Mere overexpression of SLC20A1 wt mRNA in zfl resulted in phenotypical aberrations, which did not fit the grading characteristics and the phenotypes observed in slc20a1a MO KD. Further, pure SLC20A1 overexpression in zfl resulted in higher lethality compared to non-injected control groups (data not shown). These findings suggest that the MO rescue effect of SLC20A1 wt mRNA is weakened and disguised by the mRNA’s general negative overexpression effect. (E) Kaplan-Meyer curve shows significantly reduced survival (p < 0.0001) in slc20a1a MO-injected group compared to uninjected and control MO. Survival rates by day five post-fertilization: WT = 100%, control MO injected group = 93%, MO injected group = 35% (including all grades). Exclusion of embryos dying/not developing by 8 h post-fertilization (hpf) due to failed fertilization or consequences of tissue damage caused by injections with mechanical manipulation. Within these initial 8 hpf intervals, no difference was seen between control MO and slc20a1a MO injected groups.
|
