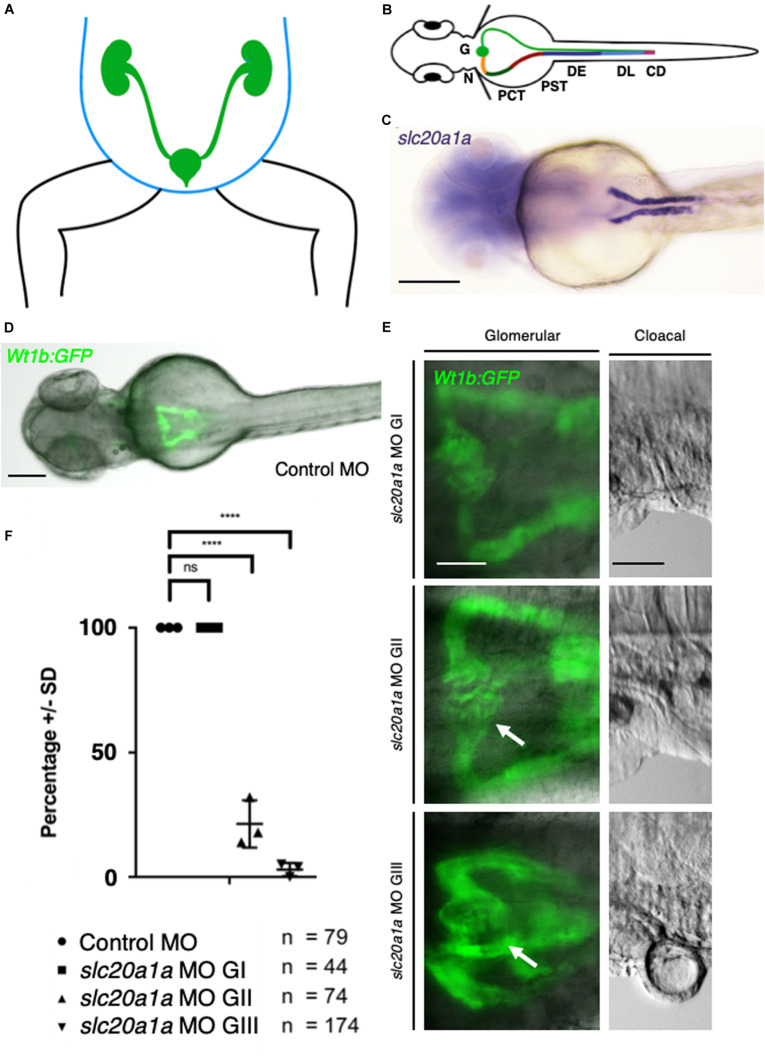
IMAGE

FIGURE 2

ID
ZDB-IMAGE-200829-25
Genes
Source
Figures for Rieke et al., 2020
Image
Figure Caption

FIGURE 2

Pronephric cysts in slc20a1a MO KD resulting from cloacal obstruction due to malformations. (A) Scheme of human abdomen, green: urogenital tract with kidneys, ureter, bladder, urethra; blue: abdominal wall. (B) Pronephros in zfl (green: right side) as equivalent to human urinary tract. Scheme of zfl, dorsal view at (2 dpf, patterning of zebrafish pronephros is similar to human nephron segmentation. Specific segments are color coded (left side) for better identification: G, Glomerulus; N, Neck; PCT, Proximal Convoluted Tubule; PST, Proximal Straight Tubule; DE, Distal Early; DL, Distal Late; CD, Collecting Duct. (C) Whole mount in situ hybridization (WISH) against slc20a1a in zfl at 2 dpf, labeling proximal part of pronephros. Scale bar: 500 μm. (D) Control MO zfl in Tg(wt1b:GFP) (Perner et al., 2007) marking proximal part of pronephros, Scale bar: 100 μm. (E) Glomerular close-ups in Tg(wt1b:GFP) zfl in dorsal view at 2 dpf (Scale bar: 50 μm). On the left, pronephric cysts (arrows) and dilatation of proximal part of pronephros increasing in severity with grading are shown. G I (upper pictures) showing no cystic phenotype, G II (middle pictures) showing a mild cyst formation, and G III (bottom pictures) showing severe cysts and a wide dilatation of the pronephros. Corresponding cloacal close-ups, shown on the right in lateral view (Scale bar: 50 μm), underline correlation between malformations in urinary outflow tract and cysts as well as pronephric dilatations in corresponding groups. (F) Graph shows percentage of zfl (Y-axis) in the following groups: Control MO, slc20a1a MO G I, slc20a1a MO G II, slc20a1a MO G III (X-axis). Each dot stands for one individual experiment (here N = 1 represents the average score in each experimental batch). Whereas control MO and slc20a1a MO G I larvae do not show any cystic phenotype, only an average of 21% of MO G II, and solely 3% of G III MO zfl show normal configuration of the proximal part of pronephros. The graph shows significant differences between control MO and phenotypically normal group MO G I compared to MO G II and G III, N = 3, ****p < 0.0001. Error bars show SD.)

Figure Data
Acknowledgments
This image is the copyrighted work of the attributed author or publisher, and ZFIN has permission only to display this image to its users. Additional permissions should be obtained from the applicable author or publisher of the image. Full text @ Front Cell Dev Biol