FIGURE SUMMARY
Title

Hcfc1a regulates neural precursor proliferation and asxl1 expression in the developing brain

Authors
Castro, V.L., Reyes, J.F., Reyes-Nava, N.G., Paz, D., Quintana, A.M.
Source
Full text @ BMC Neurosci.

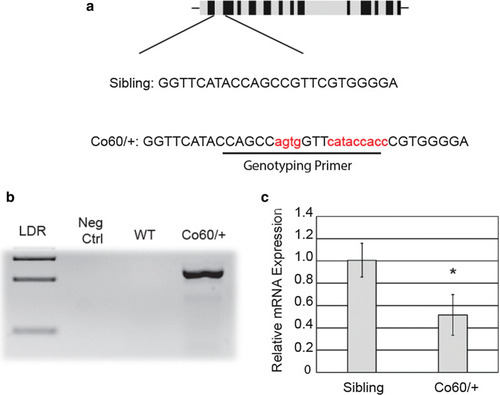
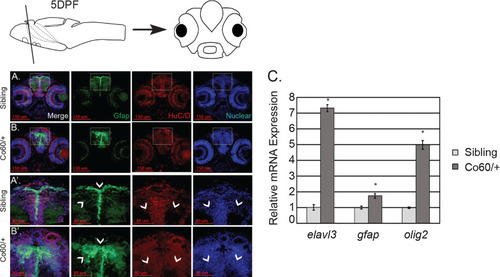
Haploinsufficiency of the hcfc1aco60/+ allele (Co60/+). a Schematic of the exon structure of the hcfc1a gene (not drawn to scale). The gRNA produced targets the sequence shown within exon 3 (Sibling). The Co60 allele results in an insertion of 13 nucleotides (Red). b Primers were designed to specifically amplify the Co60 allele. The specific primer is underlined and bolded in the sequence presented in (a). Positive amplification is indicative of heterozygous carriers (Co60/+) with no amplification of the wildtype allele (WT). c Quantitative real time PCR analyzing the relative expression of hcfc1a in wildtype siblings (Sibling) and the hcfc1aco60/+ allele (Co60/+) at 2 days post fertilization. N = 16 larvae per group with three biological replicates. *p < 0.05

EXPRESSION / LABELING:
Gene:
Fish:
Anatomical Term:
Stage: Long-pec
PHENOTYPE:
Fish:
Observed In:
Stage: Long-pec

The hcfc1aco60/+ allele increases the number of Sox2+ cells in the developing brain. a Quantitative real time PCR analyzing the relative expression of sox2 and pax6 in wildtype siblings (Sibling) and the hcfc1aco60/+ allele (Co60/+). N = 7 larvae per group/biological replicate *p < 0.05. bd Quantification of the number of Sox2+ cells at 1 day post fertilization (DPF) (b), 2 DPF (c), and 5 DPF (d) in the early forebrain (EF), forebrain (FB), midbrain (MB), and hindbrain (HB). *p = 0.006828, **p = 1.13873E−05, ***p = 0.000107, #p = 0.010168, ##p = 4.55E−06, ###p = 1.97E−07, and §p = 0.005476. In b total number of animals is Sibling (N = 6) and hcfc1aco60/+ (N = 6), c total animals is Sibling (N = 7) and hcfc1aco60/+ (N = 7), and d total animals is Sibling (N = 4) and hcfc1aco60/+ (N = 4). All error bars represent standard error of the mean

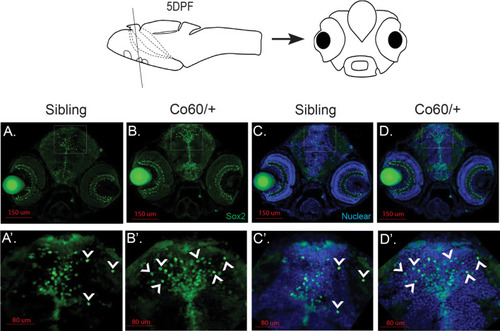
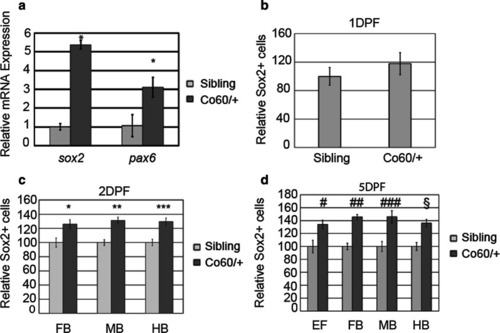
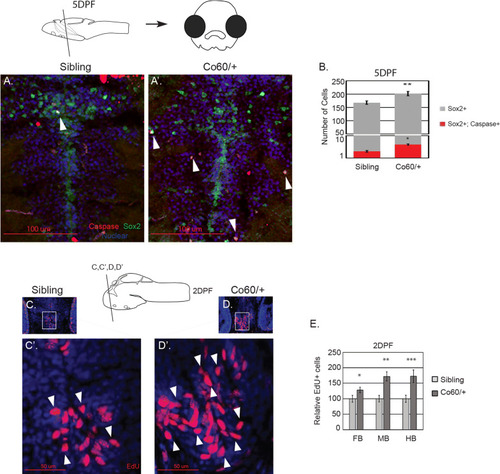
Increased Sox2+ cells are present in the hcfc1aco60/+ allele. ad, a′–d′. Representative images of brain sections from larvae at 5 days post fertilization (DPF) stained with Sox2 antibodies (green) and Hoescht DNA content dye. Whole brain (20×) and the ventricular zone (63×) are shown. Images were captured from sections on a confocal microscope. A schematic of the zebrafish at 5 DPF is shown above representative images with a line to indicate the cross section below

EXPRESSION / LABELING:
Gene:
Fish:
Anatomical Term:
Stage: Day 5
PHENOTYPE:
Fish:
Observed In:
Stage: Day 5

The hcfc1aco60/+ allele is associated with increased cell proliferation and minimal cell death. aa′ Apoptosis of Sox2+ neural precursor cells was assessed using anti-caspase 3 and anti-Sox2 antibodies at 5 days post fertilization (DPF). Representative images are depicted from sibling wildtype (Sibling) or the hcfc1aco60/+ allele (Co60/+). Arrows indicate Sox2+ Caspase+ neural precursors. b The total number of Sox2+ Caspase+ cells was quantified in wildtype siblings and the Co60/+ allele. Independently, the total number of Sox2+ was also quantified and the graph depicts the total number of Caspase positive NPCs (red bars; *p = 1.47822E−16) present within the entire Sox2+ population (gray bars; **p < 0.05). Due to the small number of total Sox2+ Caspase+ cells present, the data is depicted as total numbers of cells in the entire brain. N = 3/group. cd, c′–d′ Representative images of larvae (Sibling or Co60/+) pulsed with ethynyl-deoxyuridine (EdU) to monitor cell proliferation at 2DPF. c, d Are 20× magnifications and c′, d′ represent region in the inset at 63× magnification. e Quantification of the total number of EdU positive cells in forebrain (FB), midbrain (MB), and hindbrain (HB) of siblings and hcfc1aco60/+ larvae at 2 DPF. *p = 0.060553, **p = 0.00108, ***p = 0.006642, N = 9 per group. All error bars represent standard error of the mean

The hcfc1aco60/+ allele increases the expression of differentiation markers. a, a′, b and b′ Representative images of brain sections from Tg(gfap:EGFP) larvae harboring the hcfc1aco60/+ allele (Co60/+) at 5 days post fertilization (DPF) stained with Elavl3 (HuC/D) antibodies and Hoescht DNA content dye. 20× representatives of the entire brain (a, b) and 63× sub-regions (a′, b′) are shown. Wildtype siblings (N = 6) and hcfc1aco60/+ larvae (N = 6). Arrowheads indicate regions of increased expression/localization of protein. Arrowheads of Hoescht (Nuclear) images demonstrate regions with cell bodies. Top schematic demonstrates a 5 DPF larval brain with a line to demonstrate the region depicted below. c Quantitative real time PCR analysis of the expression of elavl3, gfap, and olig2 in siblings and hcfc1aco60/+ larvae (N = 8/group/biological replicate). Error bars represent standard error of the mean. *p < 0.05

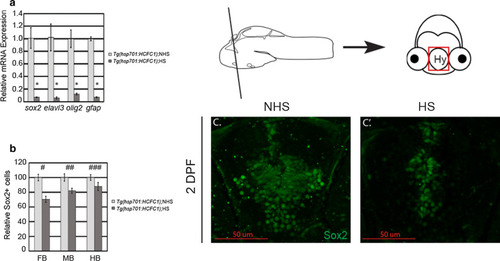
Over expression of HCFC1 decreases NPC number and differentiation.
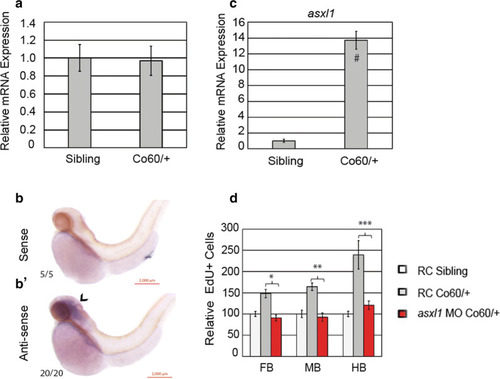
 aTg(hsp701: HCFC1) were heat shocked according to the methods section and total RNA was isolated from control (No heat shock (NHS)) and heat shock larvae (HS). Quantitative PCR was performed to test the expression of sox2, elavl3, olig2, and gfap. Error bars represent standard error of the mean. N = 28/group/biological replicate. *p < 0.05. b The total number of Sox2 cells was quantified across forebrain (#p = 4.88568E−05), midbrain (##p = 0.004359), and hindbrain (###p = 0.077). Error bars represent standard error of the mean. N = 5/group. c, c′ Representative images of 2 days post fertilization (DPF) Tg(hsp701:HCFC1) larvae (NHS or HS) stained with anti-Sox2 antibodies. Schematic demonstrates 2 DPF larval brain section with graphical inset of hypothalamus region (Hy) to specify region shown

The hcfc1aco60/+ allele regulates brain development and asxl1 expression. a Quantitative real time PCR (QPCR) analyzing the relative expression of mmachc in wildtype siblings (Sibling) and hcfc1aco60/+ larvae (Co60/+). N = 16 larvae per group with 3 biological replicates. b, b′ Whole mount in situ hybridization (ISH) was performed at 2 days post fertilization (DPF) using a riboprobe targeting asxl1 mRNA. ISH was performed with sense control (b) and anti-sense specific probe (b′). Purple demonstrates positive staining in the developing brain. N = 20. c QPCR analyzing the relative expression of asxl1 in wildtype siblings (Sibling) and the hcfc1aco60/+ allele. N = 16 larvae per group with 3 biological replicates. #p < 0.05. dhcfc1aco60/+ larvae (Co60/+) and their wildtype siblings (Sibling) were injected with translation inhibiting morpholinos targeting asxl1 (asxl1 MO) or random control (RC) morpholinos. At 2 DPF larvae were pulsed and stained for EdU incorporation and the number of EdU positive cells was counted per brain section. The total number of cells in the forebrain (FB), midbrain (MB), and hindbrain (HB) was calculated. *p = 0.000127, **p = 0.000407, ***p = 0.00712. N = 6/group

Inhibition of Asxl1 activity restores the NPC deficits in the hcfc1aco60/+ allele. aa″, bb″ and cc″ Representative 20X images of Sibling wildtype (aa″), hcfc1aco60/+ larvae (Co60/+) (bb″), or Co60/+ larvae treated with 12 μM LY294002 (cc″) at 2 days post fertilization (DPF)

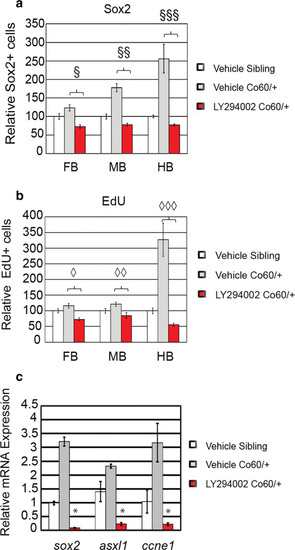
Quantification of the number of NPCs after inhibition of Asxl1 activity.
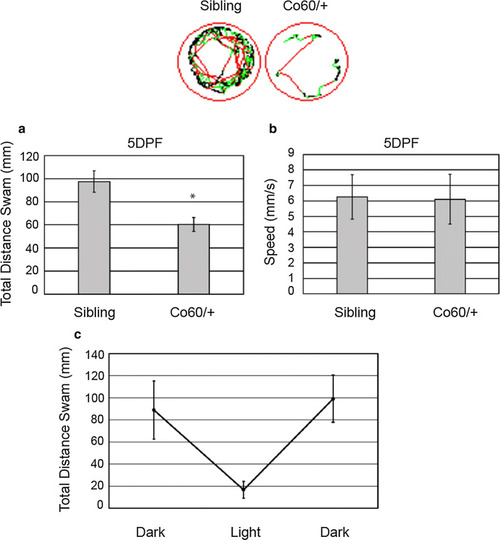
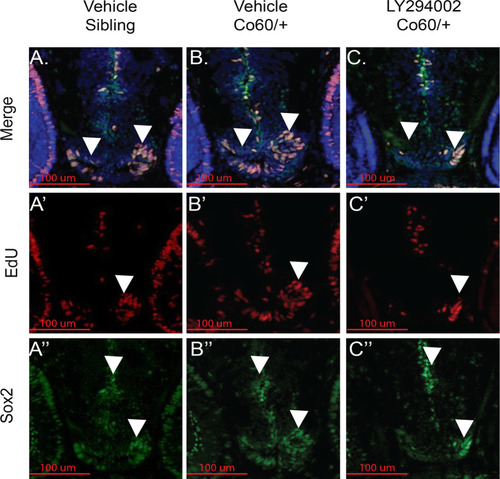
 a, b Quantification of the number of Sox2+ (a) or EdU (b) positive cells in vehicle treated and larvae treated with LY294002 at 2 days post fertilization (DFP). N = 4 Vehicle Sibling, 6 Vehicle hcfc1aco60/+ larvae, and 4 LY294002 hcfc1aco60/+ larvae. §p = 0.000168, §§p = 2.08852E−09, §§§p = 0.000153. p = 7.22142E−07, ◊◊p = 0.000997, ◊◊◊p = 0.00014. All error bars represent standard error of the mean. chcfc1aco60/+ larvae and their wildtype siblings (Sibling) were treated at 24 h intervals with 12 μM LY294002 until 5 DPF and then total RNA was isolated from brain homogenates. Quantitative real time PCR was performed to test the expression of sox2, asxl1, and cyclin E (ccne1). N = 10/group/biological replicate. Error bars represent standard error of the mean. *p < 0.05

The hcfc1aco60/+ is associated with hypomotility. Total distance (a) and average speed (b) of wildtype (Sibling) and heterozygous carriers of the hcfc1aco60/+ (Co60/+) allele were tracked at 5 days post fertilization (DPF) using ZebraBox technology. Distance and speed were monitored during light stimulus for a 5 min duration. Top panel shows representative tracking patterns from Sibling wildtype and heterozygous carriers of the Co60/+ allele. *p < 0.001. N = 52 Sibling wildtype and 56 Co60/+ individual larvae. c At 5 DPF larvae were monitored for total distance swam in alternating dark–light conditions

PHENOTYPE:
Fish:
Observed In:
Stage: Day 5
Acknowledgments
This image is the copyrighted work of the attributed author or publisher, and ZFIN has permission only to display this image to its users. Additional permissions should be obtained from the applicable author or publisher of the image. Full text @ BMC Neurosci.