IMAGE

Fig. 9

ID
ZDB-IMAGE-200614-12
Genes
Source
Figures for Castro et al., 2020
Image
Figure Caption

Fig. 9

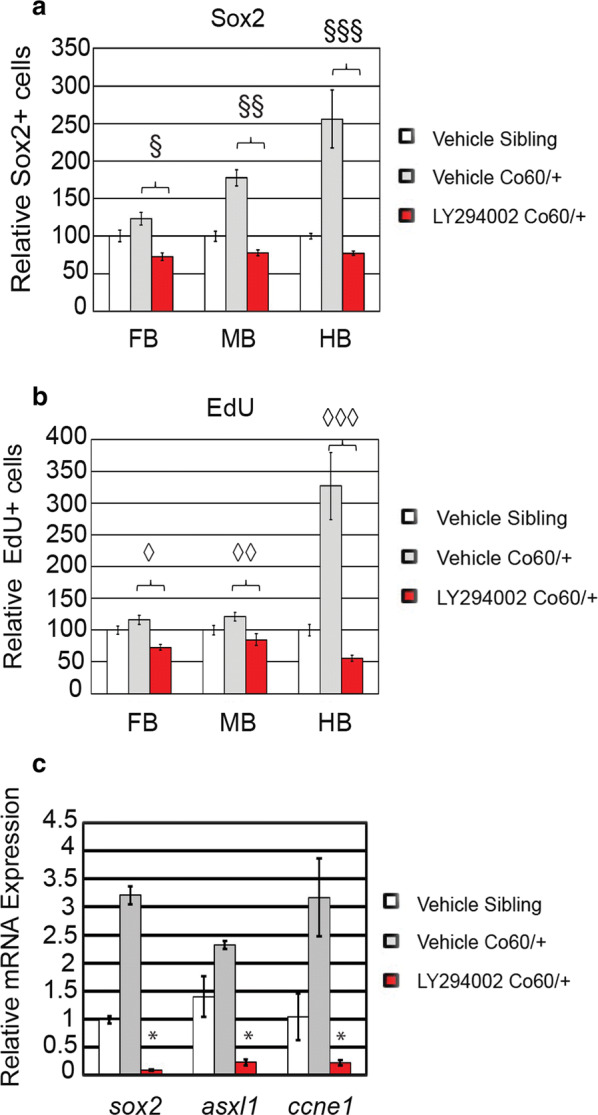
Quantification of the number of NPCs after inhibition of Asxl1 activity. a, b Quantification of the number of Sox2+ (a) or EdU (b) positive cells in vehicle treated and larvae treated with LY294002 at 2 days post fertilization (DFP). N = 4 Vehicle Sibling, 6 Vehicle hcfc1aco60/+ larvae, and 4 LY294002 hcfc1aco60/+ larvae. §p = 0.000168, §§p = 2.08852E−09, §§§p = 0.000153. p = 7.22142E−07, ◊◊p = 0.000997, ◊◊◊p = 0.00014. All error bars represent standard error of the mean. chcfc1aco60/+ larvae and their wildtype siblings (Sibling) were treated at 24 h intervals with 12 μM LY294002 until 5 DPF and then total RNA was isolated from brain homogenates. Quantitative real time PCR was performed to test the expression of sox2, asxl1, and cyclin E (ccne1). N = 10/group/biological replicate. Error bars represent standard error of the mean. *p < 0.05

Figure Data
Acknowledgments
This image is the copyrighted work of the attributed author or publisher, and ZFIN has permission only to display this image to its users. Additional permissions should be obtained from the applicable author or publisher of the image. Full text @ BMC Neurosci.