
- Title
-
Cell-fate plasticity, adhesion and cell sorting complementarily establish a sharp midbrain-hindbrain boundary
- Authors
- Kesavan, G., Machate, A., Hans, S., Brand, M.
- Source
- Full text @ Development
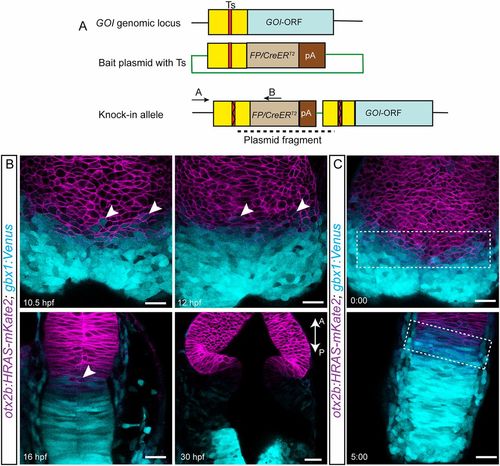
Initially overlapping expression domains segregate over time. (A) The knock-in strategy used for generating transgenic fish is schematized. A target site (Ts) located upstream of the open reading frame (ORF) of a gene of interest (GOI) is chosen. A bait plasmid is constructed by cloning the sequence upstream of the ORF, including the target site. The bait plasmid, sgRNA against the target site and Cas9 mRNA are injected into the embryo at the one-cell stage. The Cas9 protein creates double-stranded breaks at both Ts in the genomic locus and in the bait; this is followed by integration of the linearized bait plasmid. Only integration in the forward orientation will result in fluorescent reporter or CreERT2 expression. The primer pair (A+B) can be used to screen for and verify precise integration of the plasmid. The forward primer A is located outside the bait and the reverse primer B is located within the fluorescent reporter/CreERT2 sequence. (B) Live imaging was used to follow the expression of both mKate2 (membrane localized) and Venus, driven by the otx2b and gbx1 locus, respectively, at the various time points indicated. Overlapping expression boundaries were initially observed during the segmentation stages, i.e. between 10.5 and 16 hpf, and these segregated over time, based on changes in the presence of double-positive cells (mKate2 and Venus positive, indicated with arrowheads). The above-described phenotype was consistently observed in multiple embryos, and the total number of embryos (n) analyzed for each stage are: 10.5 hpf (n=7), 12 hpf (n=7), 16 hpf (n=4) and 30 hpf (n=4). (C) Snapshots from the time lapse imaging movie are shown; the overlapping otx2b-gbx1 region is indicated with a dotted rectangle. Time is shown in h:min. Scale bars: 20 µm. GOI, gene of interest; FP, fluorescent protein. The anterior-posterior axes of the embryos are marked with A-P and an arrow. EXPRESSION / LABELING:
|
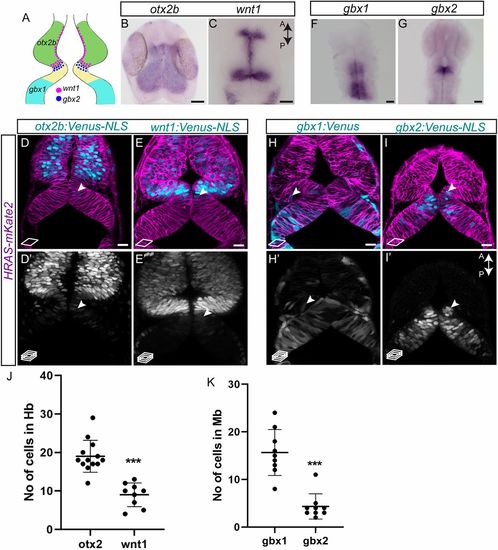
Lineage restriction in the midbrain and the hindbrain occurs at the end of gastrulation. (A) Schematic representation of the various marker genes expressed at the MHB in a 24 hpf embryo. Midbrain-specific genes are otx2b (green) and wnt1 (magenta dots); hindbrain-specific genes are gbx1 (cyan) and gbx2 (blue dots). (B,C) Whole-mount in situ hybridization (flat mount) for midbrain markers in 24 hpf embryos, i.e. otx2b and wnt1, show that their expression domains abut sharply at the MHB at this time point. (D,E,H,I) Venus fluorescent protein expression at 24 hpf in live embryos. Membrane-localizing mkate2 mRNA (red fluorescent protein) was injected into one-cell stage embryos to ubiquitously label all cells and visualize tissue architecture. (D,D′) otx2b:Venus-positive cells were not only present in the midbrain domain but also in the hindbrain domain (arrowheads). (E,E′) Similarly, wnt1:Venus-positive cells were present in the midbrain domain and were observed in the hindbrain domain (arrowheads). (F,G) Whole-mount in situ hybridization (flat mount) in 24 hpf embryos for hindbrain markers, i.e. gbx1 and gbx2, shows discernible expression boundaries posterior to rhombomere 1 for gbx1 and at the MHB for gbx2 at this time point. (H,H′) In contrast to expression patterns seen in in situ hybridization, the gbx1:Venus transgenic line showed Venus-positive cells in the midbrain domain (arrowheads). (I,I′) In the gbx2:Venus transgenic line, very few Venus-positive cells could be observed in the midbrain domain, especially at the caudal midbrain domain (arrowheads). Images are from a single confocal plane in D,E,H,I, while the maximum projection images are shown in D′,E′,H′,I′. (J,K) Quantification of Venus-positive cells in their non-expression domains, i.e. otx2b and wnt1 in the hindbrain, and gbx1 and gbx2 in the midbrain, shows that greater numbers of otx2 and gbx1 cells were present in their non-expression domains, compared with wnt1 and gbx2, respectively. A two-tailed, unpaired t-test was used to calculate statistical significance. Each point in the graph represents an individual embryo with the mean and s.e.m. shown. otx2 (n=13) versus wnt1 (n=9), P<0.0001; gbx1 (n=9) versus gbx2 (n=9), ***P<0.0001. Scale bars: 10 µm in B,C,F,G; 20 µm in D,D′,E,E′,H,H′,I,I′. EXPRESSION / LABELING:
|
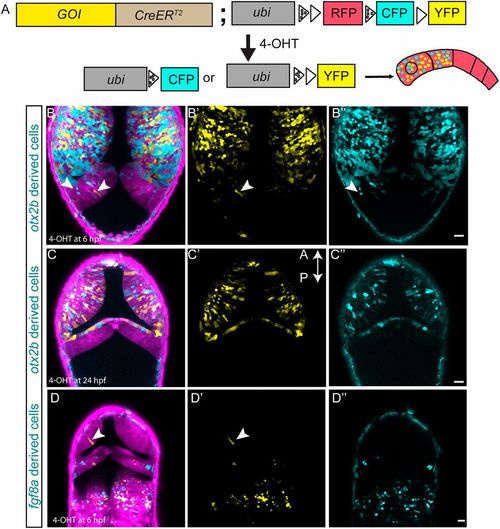
Zebrabow-based lineage tracing to visualize lineage restriction patterns at the MHB. Multicolor-labeling of midbrain and hindbrain cells using the otx2b:CreERT2 and fgf8a:CreERT2 knock-in driver lines. (A) Schematic representation of CreERT2 -mediated recombination strategy using the zebrabow transgenic responder fish. In cells expressing CreERT2, 4-OH-tamoxifen (4-OHT) induces recombination between either the two lox2272 sites (marked by spotted triangles) or the two loxp sites (marked by a triangle), which results in the stochastic labeling of cells due to the expression of CFP (cyan fluorescent protein) or YFP in the recombined cells. All non-recombined cells express only RFP (red fluorescent protein). In a cell with multiple copies of RFP, CFP and YFP, CreERT2 -mediated stochastic recombination events lead to the formation of clones marked by different colors. Embryos obtained by crossing Cre driver fish (either otx2b or fgf8a) with the zebrabow responder line were treated with 4-OH-tamoxifen, either at 6 hpf (1 μM) or 24 hpf (10 μM) for 12 h; these embryos were live-imaged at 48 hpf. (B-B″) otx2b:CreERT2 embryos treated with 4-OHT at 6 hpf show effective recombination in the midbrain region but also a few recombined cells in the hindbrain region (arrowheads). (C-C″) otx2b:CreERT2 embryos treated with 4-OHT at 24 hpf show recombined cells only in the midbrain. (D-D″) Embryos of the fgf8a:CreERT2 knock-in driver line treated with 4-OHT at 6 hpf show effective recombination in the hindbrain with the exception of a few recombined cells in the midbrain (arrowheads). The above-described phenotype was consistently observed in multiple embryos, and the total number of embryos (n) analyzed for each condition are: otx2b:CreERT2 (4-OHT at 6 hpf, n=9; at 24 hpf, n=3); fgf8a:CreERT2 (4-OHT at 6 hpf, n=6). Scale bars: 20 µm. EXPRESSION / LABELING:
|
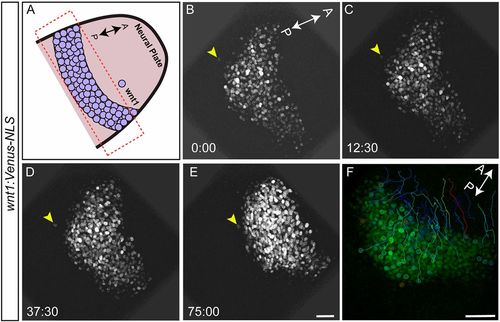
Cells sort at the MHB. To visualize cell sorting during MHB development in real time, embryos from the wnt1:Venus-NLS reporter line were mounted and imaged dorsally between 10.5 and 12 hpf, such that the neural plate and the neural keel stages were captured. Tissue sections spanning about 30 µm were chosen with a z-interval of 1 µm. Images were acquired at 2:30 (min:s) intervals. (A) Schematic representation marking the area of interest (box) and the orientation of the embryo used for time-lapse imaging. (B-E) wnt1:Venus-NLS- positive cells in the midbrain are seen undergoing morphogenetic process such as neural plate convergence and migration towards the anterior end. Importantly, one wnt1:Venus-positive cell (arrowheads) that was separated from the rest of the boundary cells showed active migration towards the group of other boundary cells. Time is in min:s. (F) Cell tracking showing the intermingling of cells with zig-zag movements and crossovers of tracks. Of the eight embryos analyzed by time-lapse imaging, active cell sorting was observed in five (62.5%). Scale bars: 40 µm. |
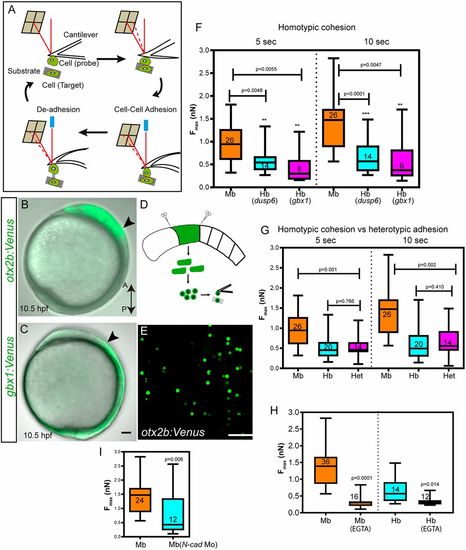
Differential adhesion as a mechanism of cell sorting at the MHB. (A) Schematic representation of atomic force microscope-based single cell force spectroscopy (AFM-SCFS). A cell attached to the cantilever is brought into contact with another cell placed on the substrate (approach). During cell-cell contact, adhesion molecules form bonds in the contact zone. After a predefined contact time, the cantilever is retracted, which results in the breaking of bonds between the two cells (retract); thus, the maximum force (Fmax, measured in nanonewtons, nN) required to separate the two cells can be measured (redrawn based loosely on Krieg et al., 2008). (B,C) Lateral views of otx2b:Venus (midbrain, Mb) and gbx1:Venus (hindbrain, hb) embryos at 10.5 hpf; arrowheads indicate the prospective MHB. (D,E) The embryos were dissociated at the tail bud stage and a single-cell suspension for SCFS was made by mechanical trituration. (F,G) Midbrain cells (otx2b:Venus-positive) showed more cohesion than hindbrain cells (gbx1 or dusp6 positive) at the 5 s and 10 s time points (homotypic adhesion), while heterotypic adhesion between Mb with Hb cells was lower than that of Mb-Mb cohesion. The P values (comparison between Mb and Hb; Mann–Whitney U-test) for the two time points are shown on the graph; n represents the number of cell pairs analyzed for each condition. (H) Depletion of Ca2+ using 5 mM EGTA addition dramatically reduced cell-cell cohesion between Mb and Hb cells. (I) Depletion of N-cadherin using a morpholino-mediated knockdown (N-cad Mo) reduced cell-cell cohesion between otx2b-positive cells (midbrain cells); n represents the number of cell pairs analyzed and is indicated within the box and whisker plot. All AFM-based experiments were repeated at least three times. Data are shown using box and whisker plots: the ends of the box are the upper and lower quartiles and the box spans the interquartile range; median is marked within the box; whiskers indicate maximum and minimum values. PHENOTYPE:
|
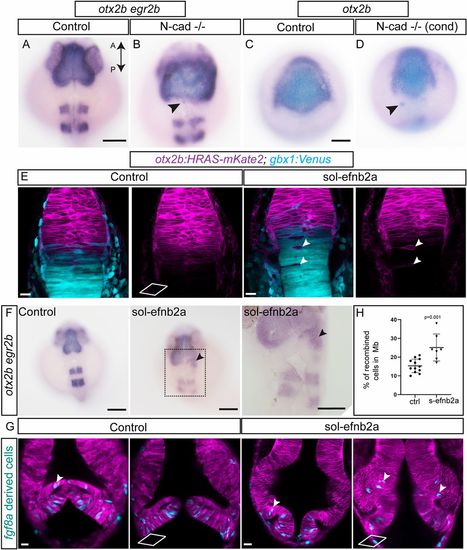
Molecular mechanisms of cell sorting at the MHB. To test whether N-cadherin (cdh2) plays a role in cell sorting, two approaches using CRISPR/Cas9-mediated mutant analysis were used. First, exons 1 and 2 of N-cadherin were targeted to generate global N-cad−/− embryos by injecting the sgRNA with Cas9 mRNA at the one-cell stage. (A,B) In situ hybridization analysis of mutant embryos at 24 hpf for otx2b and egr2b showed a disorganized pattern with fuzzy gene expression boundaries for both markers compared with control embryos. Individual otx2b cells outside their expression domain are also seen (arrowheads). This phenotype was observed in 35% of the embryos analyzed (n=26). Second, using Cre/lox-controlled Cas9 combined with the otx2b:CreERT2 driver, N-cad was conditionally (cond) ablated in the otx2b domain. (C,D) Conditional perturbation of N-cad in the midbrain resulted in irregular gene expression boundaries (otx2b) and a few cells outside the expression domain (arrowheads). This phenotype was observed in 42% of the embryos analyzed (n=90). Soluble efnb2a (sol-efnb2a) was injected as mRNA in one-cell stage embryos in the otx2b:HRAS-mKate2; gbx1:venus double transgenic line. (E) Perturbed Eph-ephrin signaling resulted in mis-sorting of cells across the MHB, presence of single otx2b-positive cells in the hindbrain (arrowheads) and otx2b-positive, gbx1-positive cells distributed further away from the Otx-Gbx overlapping domain. (F) In situ hybridization analysis of embryos analyzed at 24 hpf for otx2b and egr2b showed the presence of otx2b-positive cells outside their expression domain in sol-efnb2a-injected embryos (arrowheads; region marked with a dotted rectangle is enlarged in the panel below). This phenotype was observed in 44% of the embryos analyzed (n=206). (G) Embryos of the Tg(fgf8a:CreERT2); Tg(hsp70l:loxP-DsRed-loxP-EGFPNLS) cross were injected with sol-efnb2a and HRAS-mKate2 (to mark cell membrane) at the one-cell stage. 4-OH tamoxifen-mediated recombination was induced at 6 hpf. Embryos were heat shocked at 24 hpf (to label recombined cells) and imaged at 36 hpf. Perturbed Eph-ephrin signaling resulted in greater numbers of fgf8-derived cells in the midbrain domain (arrowheads). Two representative sections from the dorsal (top) and ventral (bottom) domains are shown. (H) Quantification of fgf8a-derived recombined cells in the midbrain (control versus s-efnb2a) showed greater cell numbers in s-efnb2a-treated embryos. A two-tailed, unpaired t-test was used to calculate statistical significance; each point in the graph represents an individual embryo with the mean and s.e.m. shown (control, ctrl, n=12; s-efb2a, n=7; P=0.0010). Scale bars: 100 µm in A-D,F; 20 µm in E,G. |