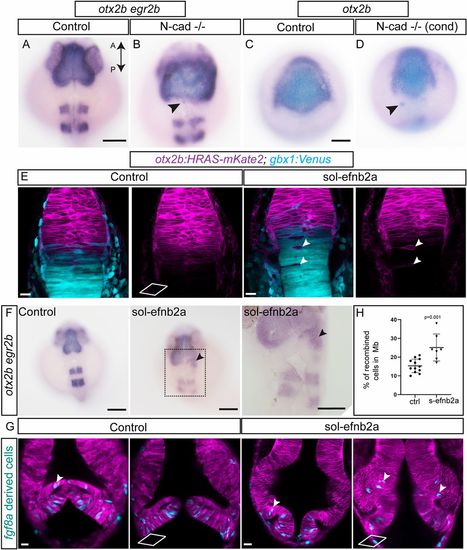
Molecular mechanisms of cell sorting at the MHB. To test whether N-cadherin (cdh2) plays a role in cell sorting, two approaches using CRISPR/Cas9-mediated mutant analysis were used. First, exons 1 and 2 of N-cadherin were targeted to generate global N-cad−/− embryos by injecting the sgRNA with Cas9 mRNA at the one-cell stage. (A,B) In situ hybridization analysis of mutant embryos at 24 hpf for otx2b and egr2b showed a disorganized pattern with fuzzy gene expression boundaries for both markers compared with control embryos. Individual otx2b cells outside their expression domain are also seen (arrowheads). This phenotype was observed in 35% of the embryos analyzed (n=26). Second, using Cre/lox-controlled Cas9 combined with the otx2b:CreERT2 driver, N-cad was conditionally (cond) ablated in the otx2b domain. (C,D) Conditional perturbation of N-cad in the midbrain resulted in irregular gene expression boundaries (otx2b) and a few cells outside the expression domain (arrowheads). This phenotype was observed in 42% of the embryos analyzed (n=90). Soluble efnb2a (sol-efnb2a) was injected as mRNA in one-cell stage embryos in the otx2b:HRAS-mKate2; gbx1:venus double transgenic line. (E) Perturbed Eph-ephrin signaling resulted in mis-sorting of cells across the MHB, presence of single otx2b-positive cells in the hindbrain (arrowheads) and otx2b-positive, gbx1-positive cells distributed further away from the Otx-Gbx overlapping domain. (F) In situ hybridization analysis of embryos analyzed at 24 hpf for otx2b and egr2b showed the presence of otx2b-positive cells outside their expression domain in sol-efnb2a-injected embryos (arrowheads; region marked with a dotted rectangle is enlarged in the panel below). This phenotype was observed in 44% of the embryos analyzed (n=206). (G) Embryos of the Tg(fgf8a:CreERT2); Tg(hsp70l:loxP-DsRed-loxP-EGFPNLS) cross were injected with sol-efnb2a and HRAS-mKate2 (to mark cell membrane) at the one-cell stage. 4-OH tamoxifen-mediated recombination was induced at 6 hpf. Embryos were heat shocked at 24 hpf (to label recombined cells) and imaged at 36 hpf. Perturbed Eph-ephrin signaling resulted in greater numbers of fgf8-derived cells in the midbrain domain (arrowheads). Two representative sections from the dorsal (top) and ventral (bottom) domains are shown. (H) Quantification of fgf8a-derived recombined cells in the midbrain (control versus s-efnb2a) showed greater cell numbers in s-efnb2a-treated embryos. A two-tailed, unpaired t-test was used to calculate statistical significance; each point in the graph represents an individual embryo with the mean and s.e.m. shown (control, ctrl, n=12; s-efb2a, n=7; P=0.0010). Scale bars: 100 µm in A-D,F; 20 µm in E,G.
|
