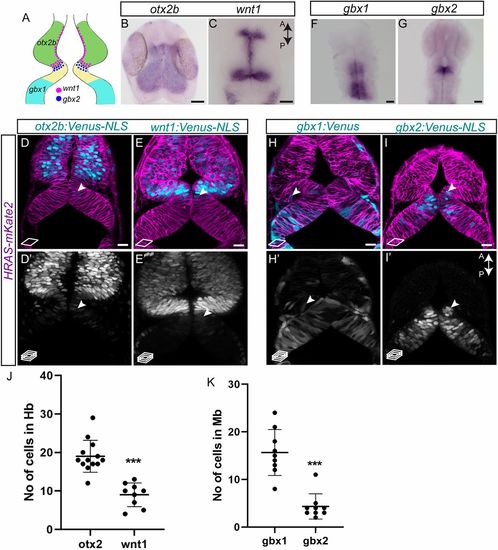
Lineage restriction in the midbrain and the hindbrain occurs at the end of gastrulation. (A) Schematic representation of the various marker genes expressed at the MHB in a 24 hpf embryo. Midbrain-specific genes are otx2b (green) and wnt1 (magenta dots); hindbrain-specific genes are gbx1 (cyan) and gbx2 (blue dots). (B,C) Whole-mount in situ hybridization (flat mount) for midbrain markers in 24 hpf embryos, i.e. otx2b and wnt1, show that their expression domains abut sharply at the MHB at this time point. (D,E,H,I) Venus fluorescent protein expression at 24 hpf in live embryos. Membrane-localizing mkate2 mRNA (red fluorescent protein) was injected into one-cell stage embryos to ubiquitously label all cells and visualize tissue architecture. (D,D′) otx2b:Venus-positive cells were not only present in the midbrain domain but also in the hindbrain domain (arrowheads). (E,E′) Similarly, wnt1:Venus-positive cells were present in the midbrain domain and were observed in the hindbrain domain (arrowheads). (F,G) Whole-mount in situ hybridization (flat mount) in 24 hpf embryos for hindbrain markers, i.e. gbx1 and gbx2, shows discernible expression boundaries posterior to rhombomere 1 for gbx1 and at the MHB for gbx2 at this time point. (H,H′) In contrast to expression patterns seen in in situ hybridization, the gbx1:Venus transgenic line showed Venus-positive cells in the midbrain domain (arrowheads). (I,I′) In the gbx2:Venus transgenic line, very few Venus-positive cells could be observed in the midbrain domain, especially at the caudal midbrain domain (arrowheads). Images are from a single confocal plane in D,E,H,I, while the maximum projection images are shown in D′,E′,H′,I′. (J,K) Quantification of Venus-positive cells in their non-expression domains, i.e. otx2b and wnt1 in the hindbrain, and gbx1 and gbx2 in the midbrain, shows that greater numbers of otx2 and gbx1 cells were present in their non-expression domains, compared with wnt1 and gbx2, respectively. A two-tailed, unpaired t-test was used to calculate statistical significance. Each point in the graph represents an individual embryo with the mean and s.e.m. shown. otx2 (n=13) versus wnt1 (n=9), P<0.0001; gbx1 (n=9) versus gbx2 (n=9), ***P<0.0001. Scale bars: 10 µm in B,C,F,G; 20 µm in D,D′,E,E′,H,H′,I,I′.
|
