
- Title
-
Genetic Deletion of Zebrafish Rab28 Causes Defective Outer Segment Shedding, but Not Retinal Degeneration
- Authors
- Carter, S.P., Moran, A.L., Matallanas, D., McManus, G.J., Blacque, O.E., Kennedy, B.N.
- Source
- Full text @ Front Cell Dev Biol
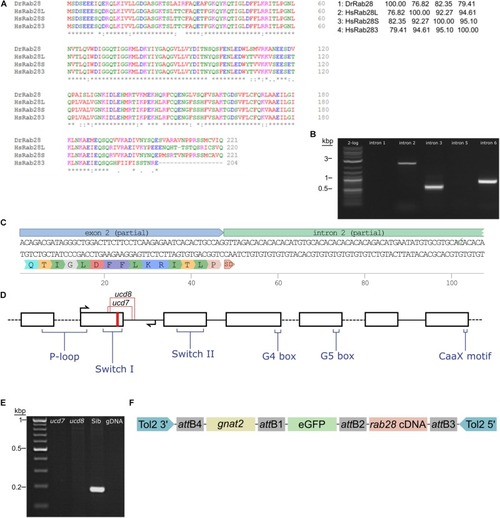
Sequencing of the zebrafish |
PHENOTYPE:
|
|
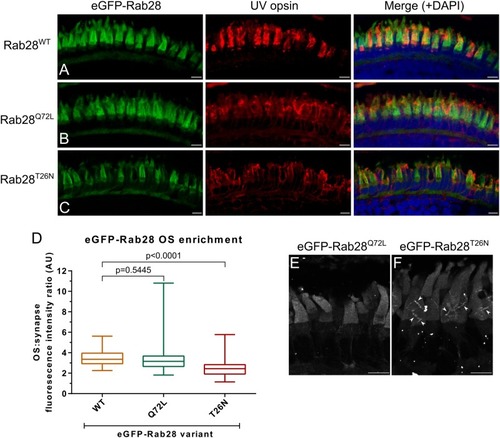
eGFP-Rab28 localization to larval zebrafish cone outer segments is partially dependent on GTP/GDP-binding. |
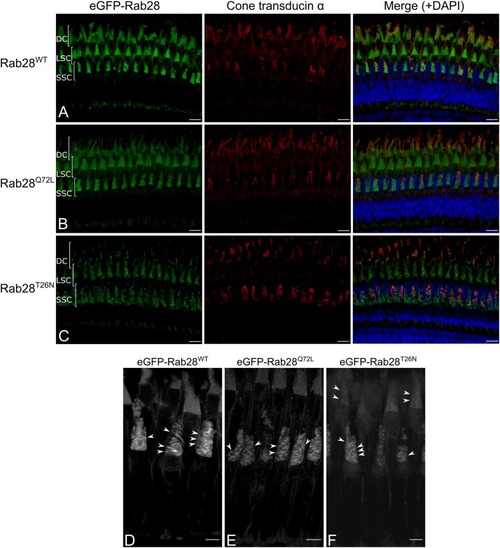
eGFP-Rab28 localization in 1 mpf zebrafish cone photoreceptors. EXPRESSION / LABELING:
|
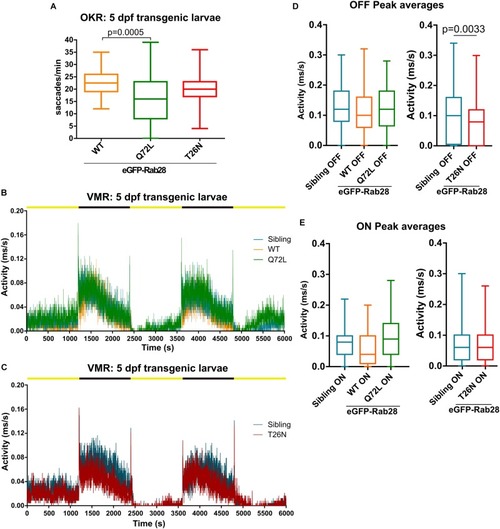
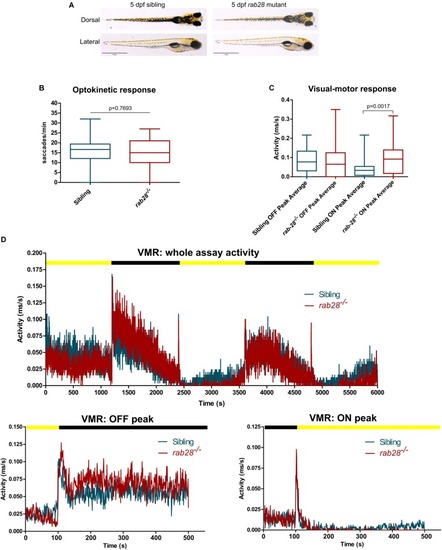
Rab28 transgenic zebrafish have mild to moderate visual defects at 5 dpf. PHENOTYPE:
|
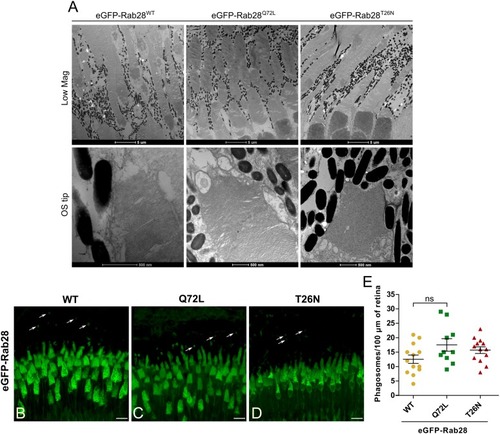
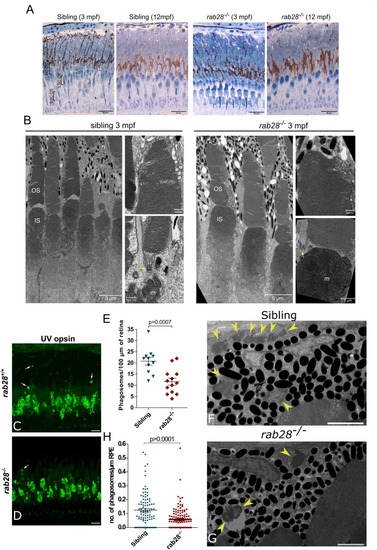
Rab28 transgenic zebrafish have normal retinal ultrastructure and normal outer segment shedding. PHENOTYPE:
|
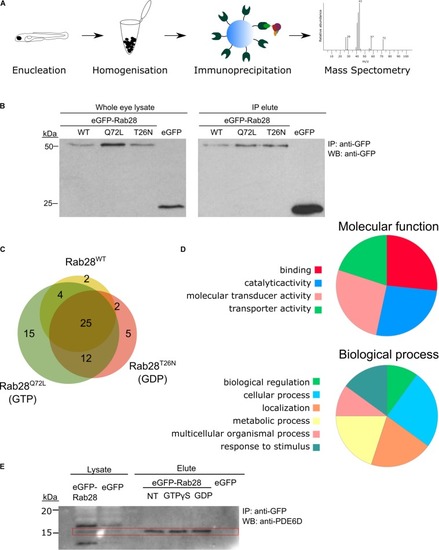
Rab28 interacts with multiple phototransduction proteins in the zebrafish eye. |