IMAGE

FIGURE 1

ID
ZDB-IMAGE-200423-17
Source
Figures for Carter et al., 2020
Image
Figure Caption

FIGURE 1

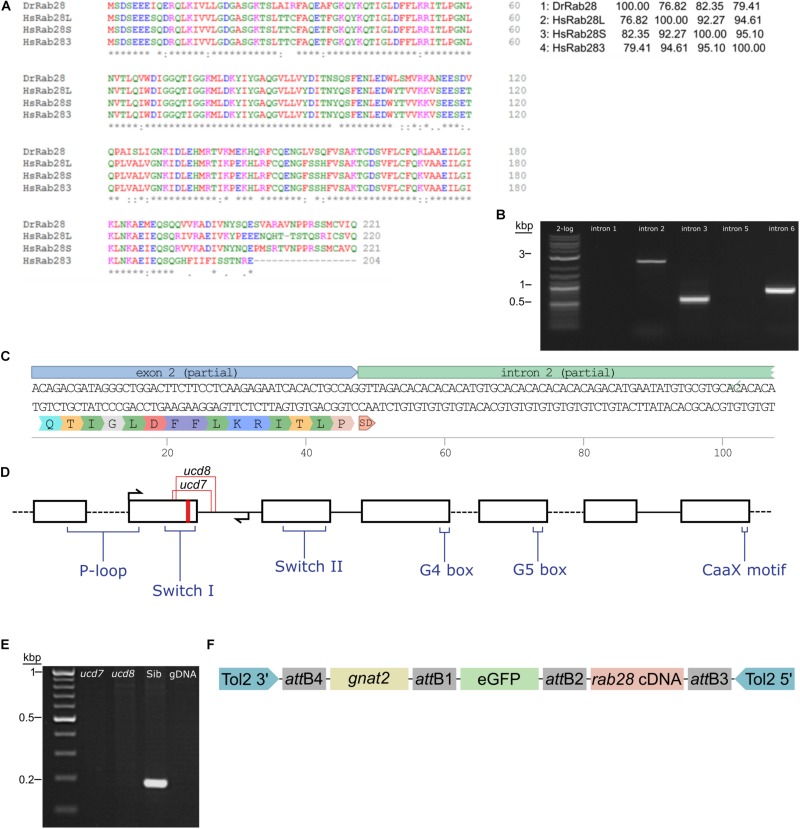
Sequencing of the zebrafish rab28 gene, CRISPR mutagenesis and Tol2 transgenesis. (A) Multiple sequence alignment of zebrafish Rab28 protein sequence, predicted from mRNA, with that of the three known human RAB28 protein isoforms. The percentage protein identity is shown in a matrix table. (B) Representative gel showing PCR amplification of predicted rab28 introns 2, 3, and 6. (C) DNA sequencing reveals the exon–intron boundary at exon 2 of zebrafish rab28 and the predicted translated sequence encoded by exon 2. SD: splice-donor site. (D) Schematic of predicted rab28 gene structure. Black boxes represent exons and connecting lines represent introns. Red stripe indicates location of sgRNA target site used to generate CRISPR mutants, arrows indicate genotyping primer positions, coding positions for critical Rab GTPase motifs are highlighted and the location of ucd7 and ucd8 indels indicated. (E) Example RT-PCR gel showing the absence of correctly spliced rab28 cDNA between exons 2 and 4 in homozygous ucd7 and ucd8 larvae, which is present in WT siblings. (F) Schematic of the construct used to generate eGFP-Rab28 transgenic zebrafish. Expression is driven by the gnat2 (cone transducin alpha) promoter (yellow box). att: Gateway att sites, Tol2 3′ and 5′: transposon inverted repeats.

Acknowledgments
This image is the copyrighted work of the attributed author or publisher, and ZFIN has permission only to display this image to its users. Additional permissions should be obtained from the applicable author or publisher of the image. Full text @ Front Cell Dev Biol