
- Title
-
Fibronectin is a smart adhesive that both influences and responds to the mechanics of early spinal column development
- Authors
- Guillon, E., Das, D., Jülich, D., Hassan, A.R., Geller, H., Holley, S.
- Source
- Full text @ Elife

ZFIN is incorporating published figure images and captions as part of an ongoing project. Figures from some publications have not yet been curated, or are not available for display because of copyright restrictions. PHENOTYPE:
|
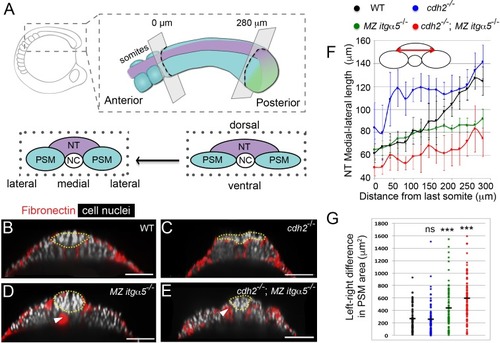
Reduction of Fibronectin matrix enhances neural tube convergence but abrogates bilaterally symmetric paraxial mesoderm morphogenesis.(A) A schematic of the zebrafish tailbud and two transverse sections at the anterior and posterior ends of the presomitic mesoderm (PSM, cyan). The left and right PSM flank the neural tube (NT, magenta) and notochord (NC). The neural tube and PSMs converge along the medial-lateral axis, and the anterior tailbud is further converged than the less developed posterior tailbud. (B–E) Transverse sections 160 μm posterior to the last somite boundary at 12–14 somite stage in wt (B), cdh2-/- (C), MZ itgα5-/- (D), and cdh2-/-; MZ itgα5-/- (E). Sections were reconstructed at a distance of 160–180 μm from last somite boundary after wholemount labeling for fibronectin (red) and nuclei (grey). Yellow dotted lines delineate neural tube contours. White arrowheads indicate locations of tissue detachment (also see Figure 1—figure supplement 2E and F). Dorsal is to the top. Scale bars = 70 μm. (F) Quantification of the medial-lateral length of the neural tube (as indicated by red double arrow) along the anterior-posterior axis starting from the last somite boundary. Quantifications were performed on transverse sections spaced every 20 μm. Dots represent means and error bars represent SD. Sample size: n = 10 PSMs on five embryos for each genotype. (G) Quantification of left-right asymmetry in PSM area. Each dot denotes an absolute difference in left and right PSM areas at each transverse section. Sample size: n = 75 sections from five embryos for each genotype. ***p<0.0005, T-test. cdh2-/- vs WT, p=0.79; MZ itgα5-/- vs WT, p=2.51e-4; MZ itgα5-/-;cdh2-/- vs WT, p=3.34e-10. PHENOTYPE:
|
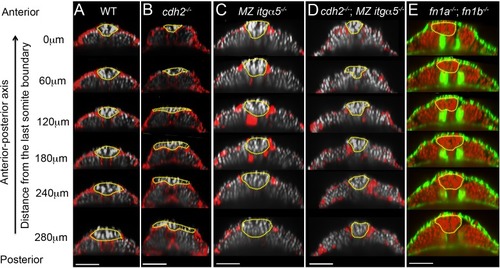
Reduction of cell-ECM interactions leads to precocious neural tube convergence and rescues cdh2 mutant neural tube convergence defects.Each column shows a series of transverse sections in 12–14 somite stage embryos along the anterior-posterior axis of the tailbud starting from the last somite boundary (0 μm) in WT (A), cdh2-/- mutants (B), MZ itgα5-/- mutants (C), cdh2-/-; MZ itgα5-/- mutants (D), and fn1a-/; fn1b-/-mutants. (A–D) Immunostaining for FN (red) and nuclei labeling (grey). (E) F-actin labeling (green), and nuclei labeling (red). Yellow dotted lines delineate neural tube contours. Dorsal is to the top. Scale bars = 70 μm. |
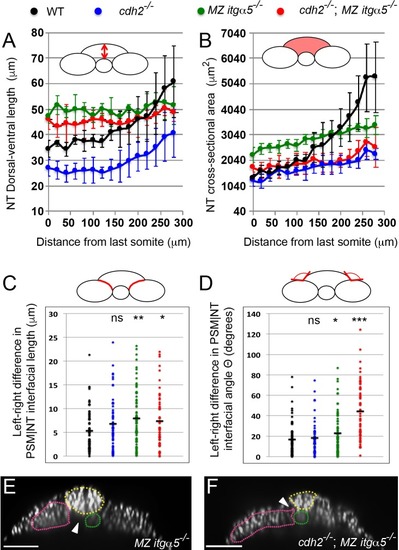
Reduction of cell matrix interactions provokes a precocious neural tube convergence and generates left-right asymmetries in the PSM|NT interfacial length and angle.(A, B) Quantification of the dorsal-ventral length (A, as indicated by red double arrow) and the cross-sectional area (B, as indicated by the red area) of the neural tube along the anterior-posterior axis starting from the last somite boundary (0 μm). Measurements were performed on transverse sections taken every 20 μm. Dots represent means and error bars represent SD. Sample size n = 10 PSMs on five embryos for each genotype. (C, D) Quantification of left-right asymmetry in PSM|NT interfacial length (C) and PSM|NT interfacial angle (D). Each dot denotes an absolute difference in left and right PSM|NT interfacial length or angle in a transverse section. Sample size n = 75 sections from five embryos for each genotype. ***p<0.0005, **p<0.005, *p<0.05, via T-test. (C) cdh2-/- vs WT, p=0.095; MZ itgα5-/- vs WT, p=1.8e-3; MZ itgα5-/-; cdh2-/- vs WT, p=0.23. (D) cdh2-/- vs WT, p=0.57; MZ itgα5-/- vs WT, p=0.046; MZ itgα5-/-; cdh2-/- vs WT, p=1.56e-9. (E–F) Transverse sections for MZ itgα5-/- (E), and cdh2-/-; MZ itgα5-/- (F) identical to those presented in Figure 1D and Figure 1E but showing only the nuclei signal to highlight tissue detachments (arrowheads) between the notochord (green), the PSM (pink) and the neural tube(yellow). |
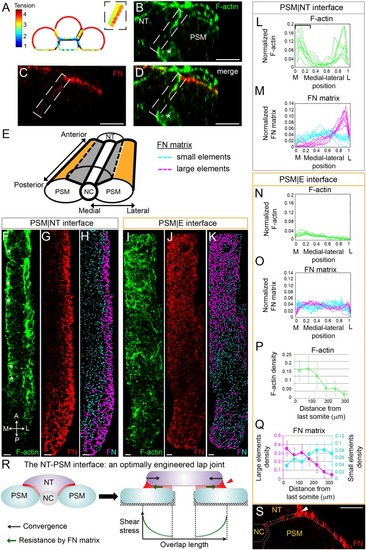
Gradients of Fibronectin matrix and F-actin correlate with in silico gradients of tension.(A) Heat map of the tension distribution along tissue surfaces in silico. Warmer colors represent higher tension. Inset: magnification of the PSM|NT interface showing a medial-lateral tension gradient on the neural tube side of the interface. (B–D) Transverse sections taken 60 μm away from last somite boundary on a 12–14 s stage embryo co-labeled for Fibronectin (FN, red) and F-actin (green). There are colocalized medial-lateral gradients of both F-actin and Fibronectin matrix along the PSM|NT interface (dashed box). Star denotes differentiating myofibers that show high F-actin signal. Scale bars = 20 μm. (E) 3D schematic of the PSM|NT interface (grey) and the PSM|E interface (orange). To quantify matrix assembly along these interfaces, FN matrix signal is sorted into two categories based on size: small matrix elements (cyan) and large matrix elements (magenta). See SI for details. The F-actin signal (F, I), FN signal (G, J), and processed images of small and large matrix elements (H, K) are shown. The PSM|NT interface exhibits medial-lateral gradients of F-actin and Fibronectin (F–H), whereas the PSM|E interface shows an increase in F-actin and Fibronectin matrix assembly along the posterior to anterior axis (I–K). All images are projected dorsal views. A = anterior, P=posterior, M = medial, L = lateral. Scale bar = 10 μm. Quantification of the medial-lateral distributions of F-actin (L) and small and large FN matrix elements (M) along the PSM|NT interface. The bracket in (L) denotes the differentiating myofibers rich in F-actin. Quantification of the medial-lateral distributions of F-actin (N) and small and large FN matrix elements (O) along the PSM|E interface. Quantification the density of F-actin (P) and small and large matrix elements (Q) along the anterior-posterior axis of the PSM|E interface. Data represent means and SD. Sample sizes: L, n = 8 PSMs from six embryos; N, P, n = 7 PSMs from five embryos; M, O, Q, n = 10 PSMs from six embryos. (R) The NT-PSM interfaces represented as a lap-joint with a single sided strap. Neural tube (magenta) acts as a strap that is adhered to the two PSMs (cyan) via a graded adhesive (red) made of Fibronectin. Medial and ventral edges of PSM are attached to the notochord and yolk surface respectively (dashed region). Black arrows denote neural tube convergence and green arrows denote resistance to this convergence via the adhesive. Neural tube convergence with respect to the adhesive produces shear stress. Established theories of lap-joint predict a stress gradient with higher stress at the lateral edge of the PSM|NT interface. Extra adhesive, called a ‘spew fillet,’ in an arced shape at the lateral sides of the strap strengths the joint. (S) Transverse section on a 12–14 s stage embryo labeled for Fibronectin (FN, red) illustrating the spew fillet of FN matrix (arrowhead). Scale bar = 20 μm. |
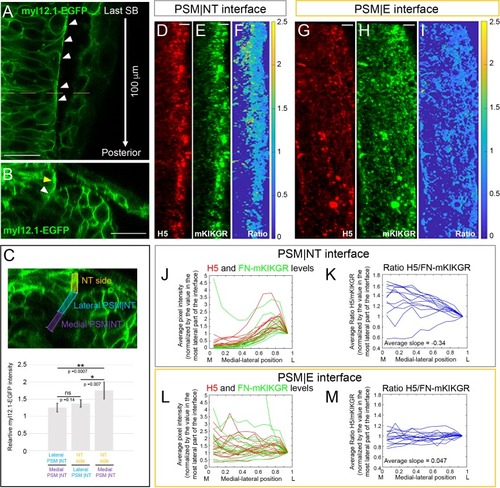
Medial-lateral gradients of Myosin II and Fibronectin matrix tension at the PSM|NT interface.(A–C) Embryos were injected with myl12.1-EGFP mRNA to visualize distribution of Myosin-II (Araya et al., 2019; Behrndt et al., 2012). (A) A dorsal view of the neural tube of a live 12-somite stage embryo. The image shows the first 100 μm posterior of the last somite boundary in a single confocal plane roughly 10 μm underneath the dorsal surface of the neural tube. Local enrichment of Myosin-II can be seen in the lateral surface of the neural tube (white arrowheads). Anterior is is up. The dashed line indicates the position of the transverse section in B. Scale bar = 25 μm. (B) A transverse section 60 μm away from last somite where enrichment of Myosin-II can be seen both along the lateral side of the neural tube (yellow arrowhead) and the lateral part of the PSM|NT interface (white arrowhead). Scale bar = 25 μm. (C) Quantification of the relative Myosin II levels reveals a medial to lateral increase of Myosin-II levels from the medial part of PSM|NT interface to the lateral side of the neural tube. Transverse sections were generated every 5 μm along the first 100 μm posterior of the last somite boundary. For each section, the neural tube border was divided into three regions as indicated on the transverse section (top panel): the medial half of the PSM|NT interface (purple), the lateral half of the PSM|NT interface (blue), and the adjacent lateral side of the NT (orange). The mean myl12.1-EGFP intensity was measured in each region, and the relative intensity ratios (Lateral PSM|NT/Medial PSM|NT; NT side/Lateral PSM|NT; NT side/Medial PSM|NT) were calculated on each slice and averaged for each embryo. Average ratios across all embryos were then plotted (bottom panel). All ratios are above 1 according to the 95% confidence intervals (error bars). The difference between the ratios was evaluated via T-test. Sample size: n = 25 data points (each point is the average of 21 slices per embryo), from 13 embryos (two sides per embryo) from four experiments. (D–I) Immunostaining with the H5 antibody on 12 s stage embryos injected with FN1a-mKIKGR13.2-hsFNIII10-11 mRNA. The H5 signal (D, G), mKIKGR signal (E, H), and processed heatmaps of the H5/mKIKGR ratio (F, I) are shown. All images are projected dorsal views with anterior to the top and medial to the left. Scale bars = 10 μm. The PSM|NT interface (D–F) exhibits an increasing medial-lateral gradient of H5. By contrast, the H5/mKIK ratio shows an opposite gradient as the tension on individual fibers is lower laterally where stresses are distributed over more Fibronectin molecules. (G–I) The PSM|E interface does not exhibit any medial-lateral gradient. (J–M) Quantification of the medial-lateral distributions of H5 and mKIKGR levels (J, L) and the H5/mKIKGR ratio (K, M) along the PSM|NT (J, K) or PSM|E (L, M) interface. Sample size: n = 12 PSM|NT and 14 PSM|E interfaces from 10 and 9 embryos, respectively from three experiments. The average slopes of the H5/mKIKGR ratios for the PSM|NT and PSM|E interfaces differ (**, p=0.0046, T-test). |
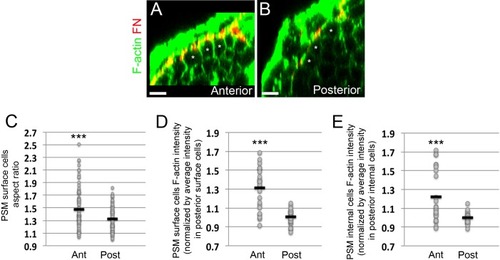
Epithelialization of PSM surface cells and increases in F-actin intensity in PSM cells as the PSM matures from posterior to anterior.(A, B) Transverse sections taken in the anterior PSM (A, 0–100 μm away from last somite boundary) or posterior PSM (B, 200–300 μm away from last somite boundary) on 12–14 s stage embryos co-stained for Fibronectin (FN, red) and F-actin (green). Asterisks denote PSM surface cells. Scale bars = 10 μm. (C) Quantification of PSM surface cell aspect ratio in the anterior and posterior portions of the PSM. Sample size: n = 93 cells (anterior PSM) and 92 cells (posterior PSM) from three embryos. Anterior vs posterior, p=7.46e-5. (D–E) Quantification of the mean F-actin intensity of the PSM surface cells region (D) or PSM internal cells region (E) in the anterior and posterior PSM from three embryos. Each dot represents a transverse section for which the mean F-actin signal within the surface cells or internal cells was measured and normalized by the average intensity of the signal in the posterior sections of the same embryo. Sample size: n = 24 sections (anterior PSM) and 25 sections (posterior PSM). ***p<0.0005 using a T-test. (D) Anterior vs posterior, p=5.62e-7. (E) (D) Anterior vs posterior, p=7.7e-4. |
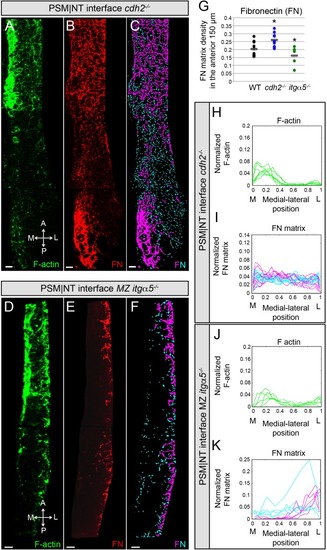
Reduction of cell-cell adhesion eliminates the medial-lateral gradients of Fibronectin matrix and F-actin.PSM|NT interfaces of cdh2-/- (A, B, C) and MZ itgα5-/- (D, E, F) mutants at the 12–14 somite stage. F-actin (A, D), Fibronectin (B, E), and processed images of small and large Fibronectin matrix elements (C, F) are shown. All images are dorsal views. A = anterior, P = posterior, M = medial, L = lateral. Scale bars = 10 μm. (G) Quantification of Fibronectin density within the anterior 150 μm of the PSM|NT interface in wild type, cdh2-/- and MZ itgα5-/-. cdh2-/- vs WT, p=9.4e-3; MZ itgα5-/- vs WT, p=0.012. Quantification of the medial-lateral distributions of the F-actin (H, J) and small and large Fibronectin matrix elements (I, K) at the PSM|NT interface in cdh2-/- (H, I) and MZ itgα5-/- (J, K). Sample sizes: G, I, K, n = 10 PSMs from six embryos for WT, n = 10 PSM from five embryos for cdh2-/-, n = 5 PSM from five embryos for MZ itgα5-/-. Sample sizes: H, n = 7 PSM from four embryos; J, n = 5 PSM from five embryos. PHENOTYPE:
|
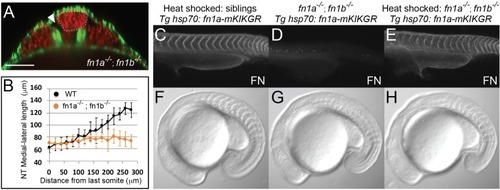
Fibronectin is required for inter-tissue adhesion and a hsp70: fn1a-mKIKGR transgene rescues fn1a -/-; fn1b-/- double mutants.(A–B) fn1a -/-; fn1b-/- double mutants exhibit a precociously converged neural tube and tissue detachment similar to MZ itgα5-/- mutants. (A) Transverse section 160 μm from last somite boundary in 12–14 somite stage fn1a-/-; fn1b -/- embryos with labeled nuclei (red) and F-actin (green). Dotted line delineates the neural tube. Arrowhead indicates tissue detachment. Scale bar = 70 μm. (B) Quantification of the medial-lateral length of the neural tube along the anterior-posterior axis starting from the last somite boundary (0 μm). Data represent means and SD. Immunostaining for Fibronectin (FN) on a 24 hpf heat shocked sibling (C), a non-heat shocked fn1a -/-; fn1b -/-; Tg hsp70: fn1a-mKIKGR embryo (D) and a heat shocked fn1a -/-; fn1b -/-; Tg hsp70: fn1a-mKIKGR embryo (E). Lateral views of the trunk with anterior to the left. DIC images of a heat shocked sibling (F), a non-heat shocked fn1a -/-; fn1b-/-; Tg hsp70: fn1a-mKIKGR embryo (G) and a heat shocked fn1a -/-; fn1b -/-; Tg hsp70: fn1a-mKIKGR embryo (H). PHENOTYPE:
|
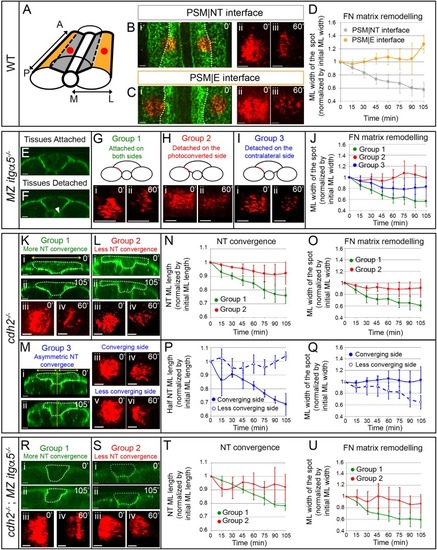
Anisotropic Fibronectin matrix remodeling dependent upon neural tube convergence and inter-tissue adhesion.(A) 3D schematic indicating positions of the photoconverted regions (red dots) along the PSM|NT and PSM|E interfaces. A = anterior; P = posterior; M = medial; L = lateral. Spots of photoconverted Fibronectin matrix at PSM|NT interface (B) or at PSM|E interface (C). (i) Dorsal views of heat-shocked Tg hsp70:fn1a-mKIKGR embryos at 12 somite stage showing Fibronectin matrix (green) and Fibronectin spots immediately after photoconversion (red). Dotted lines delineate the boundary between the PSM|NT and PSM|E interfaces. Images of spots of Fibronectin at early (ii) and late (iii) timepoints. (D) Quantification of the medial-lateral width of the photoconverted spot over time. Sample size: n = 9 spots from four embryos for each interface. (E–J) Analysis of FN matrix remodeling at PSM|NT interface in MZ itgα5-/-. (E–F) Transverse sections of heat-shocked 12 somite stage MZ itgα5-/-; Tg hsp70:fn1a-mKIKGRembryos. MZ Itgα5 mutants have local tissue detachments (arrowhead in F). (G–I) Photoconversion experiments fall into three groups based on tissue detachment at the level of the photoconverted interface (red line in schematics). (i–ii) Images of the photoconverted spots at the beginning of the movie (i) and one hour later (ii). (J) Quantification of the medial-lateral width of the photoconverted spot over time. Sample size: n = 5 spots from three embryos for each of group 1 and 2; 7 spots from four embryos for group 3. (K–Q) Analysis of FN matrix remodeling at PSM|NT interface in cdh2-/-. (K–M) Cdh2 mutants show variability in neural tube convergence and fall into three groups based on the degree of neural tube convergence at the level of the photoconverted interface. Either the neural tube converged (Group 1 (K)); did not converge (Group 2 (L)); or converged asymmetrically (Group 3 (M)). (i–ii) Transverse sections of cdh2-/-; Tg hsp70:fn1a-mKIKGR heat-shocked embryos at the beginning (i, 12 somite stage) and at the end of the time lapse (ii). Dotted lines delineate the neural tube contour. Yellow lines indicate the midline of the embryo used as reference to divide the neural tube in left and right halves. Yellow double arrows indicate how the medial-lateral width of the total neural tube or half of the neural tube was quantified. (iii-vi) Images of the photoconverted spots at the beginning of the movie (iii, v) and one hour later (iv, vi). (N, P) Quantification of the medial-lateral length of the total neural tube (N) or of the half neural tube (P) over time. Sample size: group 1, four embryos; group 2, four embryos; group, three embryos. One transverse section per embryo. (O, Q) Quantification of the medial-lateral width of the photoconverted region over time. Sample size: group 1, n = 8 spots from four embryos; group 2, 10 spots from three embryos; group 3, 3 spots from three embryos. (R–U) Analysis of FN matrix remodeling at the PSM|NT interface in cdh2-/-; MZ itgα5-/- embryos. (R, S) Embryos were sorted into two categories based on a high (Group 1) or low (Group 2) degree of neural tube convergence at the level of the photoconverted interface. (i–ii) Transverse sections of cdh2-/-; MZ itgα5-/-; hsp70:fn1a-mKIKGRheat-shocked embryos at the beginning (i, 12 somite stage) and at the end of the time lapse (ii). Dotted lines delineate the neural tube contour. (iii-iv) Images of the photoconverted spots at the beginning of the movie (iii) and 1 hr later (iv). (T) Quantification of the medial-lateral length of the neural tube over time. Sample sizes: n = 3 neural tube sections on two different embryos for each of groups 1 and 2. (U) Quantification of medial-lateral width of the photoconverted region over time. Sample sizes: n = 8 spots from three embryos for group 1; 4 spots from two embryos for group 2. All images of photoconverted spots are projected dorsal views perpendicular to the interfaces with anterior to the top and medial to the left. Scale bars of all images = 15 μm. In all plots, dots represent means and error bars represent SD. |
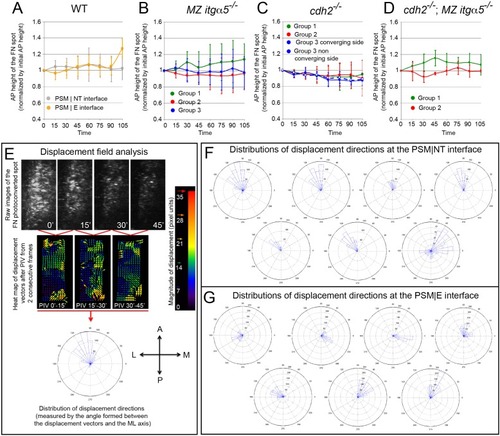
Medial-lateral ECM remodeling along the PSM|NT interface.(A–D) Quantification of the anterior-posterior length of the photoconverted FN matrix spots over time in wild-type PSM|NT and PSM|E interfaces (A), and in the PSM|NT interfaces in MZ itgα5-/-(B), cdh2-/- (C), and cdh2-/-; MZ itgα5-/- (D). In all plots, dots represent means and error bars represent SD. Sample sizes are as indicated in Figure 6. (E) Displacement field analysis of the photoconverted spots by particle image velocimetry (PIV). A displacement fields is constructed using a PIV plugin in ImageJ (see Materials and methods) using two successive time-frames. A frame-to-frame correlation of signals was established, and all vectors were plotted in a rose plot. A = anterior P=posterior M=medial L=lateral. (F–G). Distribution of displacement directions of the photoconverted regions at the PSM|NT (F) and at the PSM|E (G) interfaces in wild-type embryos. Each rose plot represents the data for one photoconverted region obtained as described in (E). In F, there is a bias toward anterior-lateral direction in six out of seven samples while there is no consistent directional bias in G. |