
Figure 3-S1
- ID
- ZDB-FIG-200406-180
- Publication
- Guillon et al., 2020 - Fibronectin is a smart adhesive that both influences and responds to the mechanics of early spinal column development
- Other Figures
- All Figure Page
- Back to All Figure Page
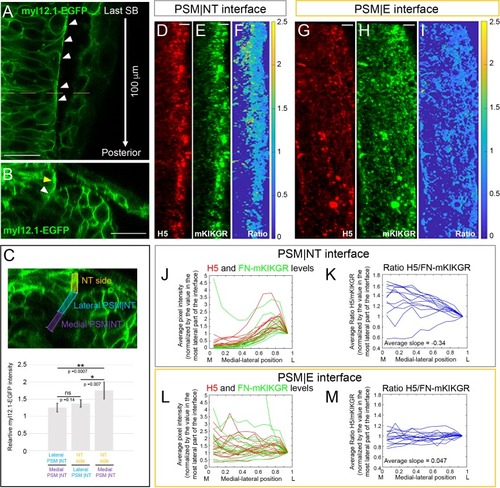
Medial-lateral gradients of Myosin II and Fibronectin matrix tension at the PSM|NT interface.(A–C) Embryos were injected with myl12.1-EGFP mRNA to visualize distribution of Myosin-II (Araya et al., 2019; Behrndt et al., 2012). (A) A dorsal view of the neural tube of a live 12-somite stage embryo. The image shows the first 100 μm posterior of the last somite boundary in a single confocal plane roughly 10 μm underneath the dorsal surface of the neural tube. Local enrichment of Myosin-II can be seen in the lateral surface of the neural tube (white arrowheads). Anterior is is up. The dashed line indicates the position of the transverse section in B. Scale bar = 25 μm. (B) A transverse section 60 μm away from last somite where enrichment of Myosin-II can be seen both along the lateral side of the neural tube (yellow arrowhead) and the lateral part of the PSM|NT interface (white arrowhead). Scale bar = 25 μm. (C) Quantification of the relative Myosin II levels reveals a medial to lateral increase of Myosin-II levels from the medial part of PSM|NT interface to the lateral side of the neural tube. Transverse sections were generated every 5 μm along the first 100 μm posterior of the last somite boundary. For each section, the neural tube border was divided into three regions as indicated on the transverse section (top panel): the medial half of the PSM|NT interface (purple), the lateral half of the PSM|NT interface (blue), and the adjacent lateral side of the NT (orange). The mean myl12.1-EGFP intensity was measured in each region, and the relative intensity ratios (Lateral PSM|NT/Medial PSM|NT; NT side/Lateral PSM|NT; NT side/Medial PSM|NT) were calculated on each slice and averaged for each embryo. Average ratios across all embryos were then plotted (bottom panel). All ratios are above 1 according to the 95% confidence intervals (error bars). The difference between the ratios was evaluated via T-test. Sample size: n = 25 data points (each point is the average of 21 slices per embryo), from 13 embryos (two sides per embryo) from four experiments. (D–I) Immunostaining with the H5 antibody on 12 s stage embryos injected with FN1a-mKIKGR13.2-hsFNIII10-11 mRNA. The H5 signal (D, G), mKIKGR signal (E, H), and processed heatmaps of the H5/mKIKGR ratio (F, I) are shown. All images are projected dorsal views with anterior to the top and medial to the left. Scale bars = 10 μm. The PSM|NT interface (D–F) exhibits an increasing medial-lateral gradient of H5. By contrast, the H5/mKIK ratio shows an opposite gradient as the tension on individual fibers is lower laterally where stresses are distributed over more Fibronectin molecules. (G–I) The PSM|E interface does not exhibit any medial-lateral gradient. (J–M) Quantification of the medial-lateral distributions of H5 and mKIKGR levels (J, L) and the H5/mKIKGR ratio (K, M) along the PSM|NT (J, K) or PSM|E (L, M) interface. Sample size: n = 12 PSM|NT and 14 PSM|E interfaces from 10 and 9 embryos, respectively from three experiments. The average slopes of the H5/mKIKGR ratios for the PSM|NT and PSM|E interfaces differ (**, p=0.0046, T-test). |