
Figure 1-S2
- ID
- ZDB-FIG-200406-176
- Publication
- Guillon et al., 2020 - Fibronectin is a smart adhesive that both influences and responds to the mechanics of early spinal column development
- Other Figures
- All Figure Page
- Back to All Figure Page
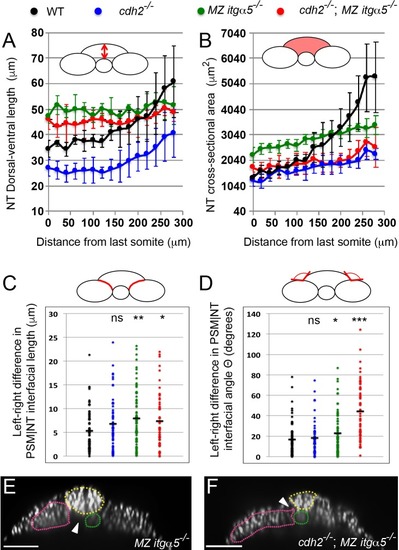
Reduction of cell matrix interactions provokes a precocious neural tube convergence and generates left-right asymmetries in the PSM|NT interfacial length and angle.(A, B) Quantification of the dorsal-ventral length (A, as indicated by red double arrow) and the cross-sectional area (B, as indicated by the red area) of the neural tube along the anterior-posterior axis starting from the last somite boundary (0 μm). Measurements were performed on transverse sections taken every 20 μm. Dots represent means and error bars represent SD. Sample size n = 10 PSMs on five embryos for each genotype. (C, D) Quantification of left-right asymmetry in PSM|NT interfacial length (C) and PSM|NT interfacial angle (D). Each dot denotes an absolute difference in left and right PSM|NT interfacial length or angle in a transverse section. Sample size n = 75 sections from five embryos for each genotype. ***p<0.0005, **p<0.005, *p<0.05, via T-test. (C) cdh2-/- vs WT, p=0.095; MZ itgα5-/- vs WT, p=1.8e-3; MZ itgα5-/-; cdh2-/- vs WT, p=0.23. (D) cdh2-/- vs WT, p=0.57; MZ itgα5-/- vs WT, p=0.046; MZ itgα5-/-; cdh2-/- vs WT, p=1.56e-9. (E–F) Transverse sections for MZ itgα5-/- (E), and cdh2-/-; MZ itgα5-/- (F) identical to those presented in Figure 1D and Figure 1E but showing only the nuclei signal to highlight tissue detachments (arrowheads) between the notochord (green), the PSM (pink) and the neural tube(yellow). |