
Figure 6
- ID
- ZDB-FIG-200406-185
- Publication
- Guillon et al., 2020 - Fibronectin is a smart adhesive that both influences and responds to the mechanics of early spinal column development
- Other Figures
- All Figure Page
- Back to All Figure Page
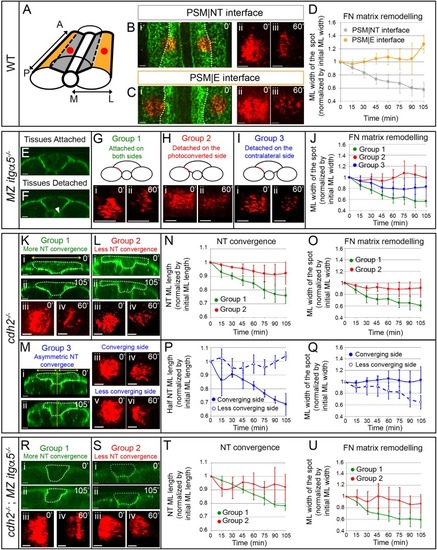
Anisotropic Fibronectin matrix remodeling dependent upon neural tube convergence and inter-tissue adhesion.(A) 3D schematic indicating positions of the photoconverted regions (red dots) along the PSM|NT and PSM|E interfaces. A = anterior; P = posterior; M = medial; L = lateral. Spots of photoconverted Fibronectin matrix at PSM|NT interface (B) or at PSM|E interface (C). (i) Dorsal views of heat-shocked Tg hsp70:fn1a-mKIKGR embryos at 12 somite stage showing Fibronectin matrix (green) and Fibronectin spots immediately after photoconversion (red). Dotted lines delineate the boundary between the PSM|NT and PSM|E interfaces. Images of spots of Fibronectin at early (ii) and late (iii) timepoints. (D) Quantification of the medial-lateral width of the photoconverted spot over time. Sample size: n = 9 spots from four embryos for each interface. (E–J) Analysis of FN matrix remodeling at PSM|NT interface in MZ itgα5-/-. (E–F) Transverse sections of heat-shocked 12 somite stage MZ itgα5-/-; Tg hsp70:fn1a-mKIKGRembryos. MZ Itgα5 mutants have local tissue detachments (arrowhead in F). (G–I) Photoconversion experiments fall into three groups based on tissue detachment at the level of the photoconverted interface (red line in schematics). (i–ii) Images of the photoconverted spots at the beginning of the movie (i) and one hour later (ii). (J) Quantification of the medial-lateral width of the photoconverted spot over time. Sample size: n = 5 spots from three embryos for each of group 1 and 2; 7 spots from four embryos for group 3. (K–Q) Analysis of FN matrix remodeling at PSM|NT interface in cdh2-/-. (K–M) Cdh2 mutants show variability in neural tube convergence and fall into three groups based on the degree of neural tube convergence at the level of the photoconverted interface. Either the neural tube converged (Group 1 (K)); did not converge (Group 2 (L)); or converged asymmetrically (Group 3 (M)). (i–ii) Transverse sections of cdh2-/-; Tg hsp70:fn1a-mKIKGR heat-shocked embryos at the beginning (i, 12 somite stage) and at the end of the time lapse (ii). Dotted lines delineate the neural tube contour. Yellow lines indicate the midline of the embryo used as reference to divide the neural tube in left and right halves. Yellow double arrows indicate how the medial-lateral width of the total neural tube or half of the neural tube was quantified. (iii-vi) Images of the photoconverted spots at the beginning of the movie (iii, v) and one hour later (iv, vi). (N, P) Quantification of the medial-lateral length of the total neural tube (N) or of the half neural tube (P) over time. Sample size: group 1, four embryos; group 2, four embryos; group, three embryos. One transverse section per embryo. (O, Q) Quantification of the medial-lateral width of the photoconverted region over time. Sample size: group 1, n = 8 spots from four embryos; group 2, 10 spots from three embryos; group 3, 3 spots from three embryos. (R–U) Analysis of FN matrix remodeling at the PSM|NT interface in cdh2-/-; MZ itgα5-/- embryos. (R, S) Embryos were sorted into two categories based on a high (Group 1) or low (Group 2) degree of neural tube convergence at the level of the photoconverted interface. (i–ii) Transverse sections of cdh2-/-; MZ itgα5-/-; hsp70:fn1a-mKIKGRheat-shocked embryos at the beginning (i, 12 somite stage) and at the end of the time lapse (ii). Dotted lines delineate the neural tube contour. (iii-iv) Images of the photoconverted spots at the beginning of the movie (iii) and 1 hr later (iv). (T) Quantification of the medial-lateral length of the neural tube over time. Sample sizes: n = 3 neural tube sections on two different embryos for each of groups 1 and 2. (U) Quantification of medial-lateral width of the photoconverted region over time. Sample sizes: n = 8 spots from three embryos for group 1; 4 spots from two embryos for group 2. All images of photoconverted spots are projected dorsal views perpendicular to the interfaces with anterior to the top and medial to the left. Scale bars of all images = 15 μm. In all plots, dots represent means and error bars represent SD. |