
Figure 3
- ID
- ZDB-FIG-200406-179
- Publication
- Guillon et al., 2020 - Fibronectin is a smart adhesive that both influences and responds to the mechanics of early spinal column development
- Other Figures
- All Figure Page
- Back to All Figure Page
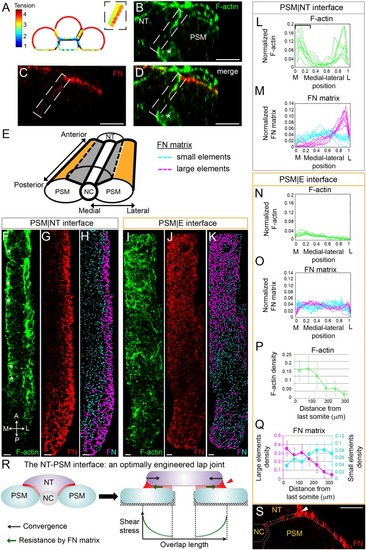
Gradients of Fibronectin matrix and F-actin correlate with in silico gradients of tension.(A) Heat map of the tension distribution along tissue surfaces in silico. Warmer colors represent higher tension. Inset: magnification of the PSM|NT interface showing a medial-lateral tension gradient on the neural tube side of the interface. (B–D) Transverse sections taken 60 μm away from last somite boundary on a 12–14 s stage embryo co-labeled for Fibronectin (FN, red) and F-actin (green). There are colocalized medial-lateral gradients of both F-actin and Fibronectin matrix along the PSM|NT interface (dashed box). Star denotes differentiating myofibers that show high F-actin signal. Scale bars = 20 μm. (E) 3D schematic of the PSM|NT interface (grey) and the PSM|E interface (orange). To quantify matrix assembly along these interfaces, FN matrix signal is sorted into two categories based on size: small matrix elements (cyan) and large matrix elements (magenta). See SI for details. The F-actin signal (F, I), FN signal (G, J), and processed images of small and large matrix elements (H, K) are shown. The PSM|NT interface exhibits medial-lateral gradients of F-actin and Fibronectin (F–H), whereas the PSM|E interface shows an increase in F-actin and Fibronectin matrix assembly along the posterior to anterior axis (I–K). All images are projected dorsal views. A = anterior, P=posterior, M = medial, L = lateral. Scale bar = 10 μm. Quantification of the medial-lateral distributions of F-actin (L) and small and large FN matrix elements (M) along the PSM|NT interface. The bracket in (L) denotes the differentiating myofibers rich in F-actin. Quantification of the medial-lateral distributions of F-actin (N) and small and large FN matrix elements (O) along the PSM|E interface. Quantification the density of F-actin (P) and small and large matrix elements (Q) along the anterior-posterior axis of the PSM|E interface. Data represent means and SD. Sample sizes: L, n = 8 PSMs from six embryos; N, P, n = 7 PSMs from five embryos; M, O, Q, n = 10 PSMs from six embryos. (R) The NT-PSM interfaces represented as a lap-joint with a single sided strap. Neural tube (magenta) acts as a strap that is adhered to the two PSMs (cyan) via a graded adhesive (red) made of Fibronectin. Medial and ventral edges of PSM are attached to the notochord and yolk surface respectively (dashed region). Black arrows denote neural tube convergence and green arrows denote resistance to this convergence via the adhesive. Neural tube convergence with respect to the adhesive produces shear stress. Established theories of lap-joint predict a stress gradient with higher stress at the lateral edge of the PSM|NT interface. Extra adhesive, called a ‘spew fillet,’ in an arced shape at the lateral sides of the strap strengths the joint. (S) Transverse section on a 12–14 s stage embryo labeled for Fibronectin (FN, red) illustrating the spew fillet of FN matrix (arrowhead). Scale bar = 20 μm. |