
- Title
-
Identification of drug modifiers for RYR1 related myopathy using a multi-species discovery pipeline
- Authors
- Volpatti, J.R., Endo, Y., Knox, J., Groom, L., Brennan, S., Noche, R., Zuercher, W.J., Roy, P., Dirksen, R.T., Dowling, J.J.
- Source
- Full text @ Elife
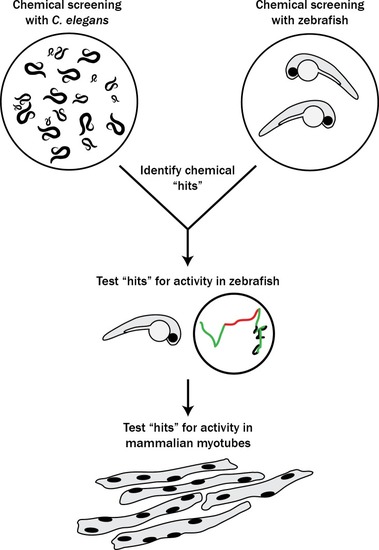
The pipeline involved screening |
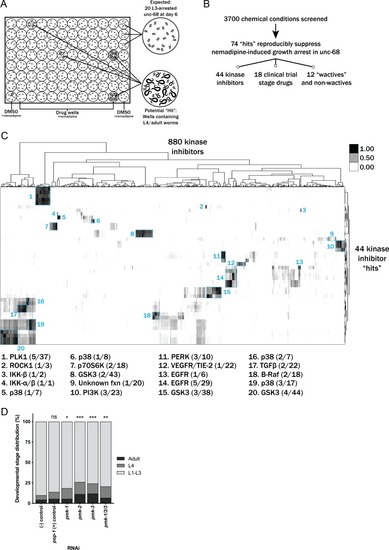
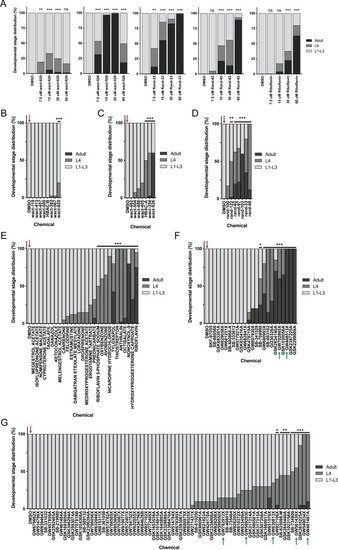
(A) Schematic of our screen methodology showing the expected growth arrest phenotype of unc-68 worms exposed to 25 μM nemadipine after 6 days of exposure and the expected phenotype of a chemical that suppresses this growth arrest. (B) Summary of the 74 ‘hits’ from this screen that reproducibly suppressed nemadipine-induced growth arrest of unc-68 mutants. (C) Heat map visualization of Tanimoto scores from the ‘hit’ compounds (y-axis) screened from the 880 compounds in the GlaxoSmithKline Published Kinase Inhibitor set (x-axis). Tanimoto scores were calculated for each pair of compounds as a measure of structural similarity and similar clusters were identified via hierarchical clustering of Tanimoto scores (legend indicates the Tanimoto score). As shown, chemicals with similar molecular fingerprints are associated with similar annotated functions/targets. Fisher’s exact test was used to determine enrichment based on the number of structurally similar members in each cluster that were either hits or not hits out of the total number of the compounds in the library. (D) RNA interference targeting either pmk-1, pmk-2, pmk-3, or a combination of the three shows that p38 MAPK gene knockdown allows a greater proportion of individual unc-68 worms to escape nemadipine-A-induced growth arrest compared to an empty vector control. Statistical analysis by Kruskal-Wallis test, followed by Dunn's post-test; ns p=0.7360, *p=0.0246, **p=0.0031, ***p<0.001; left-right: n = 406, 364, 308, 292, 276, 266. |
( |
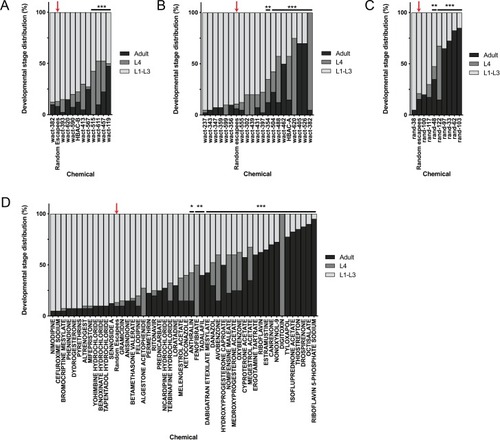
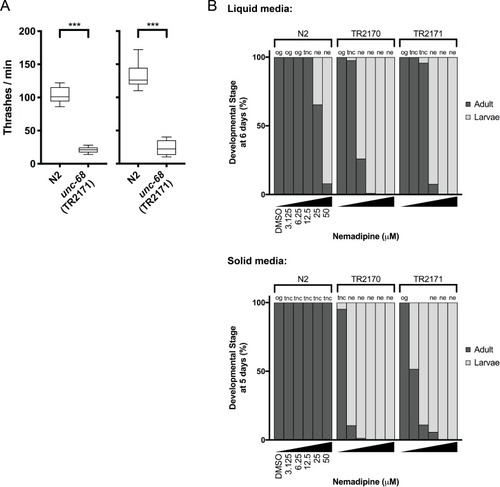
It is important to note that this was performed with the assumption that 20 worms were in each well as a means of estimating the proportion of actual L4 and adult counts in each well. In other words, we assumed #L1-L3 larvae = 20 – (#L4 + #adult). Plots shown are from independent screens of ( |
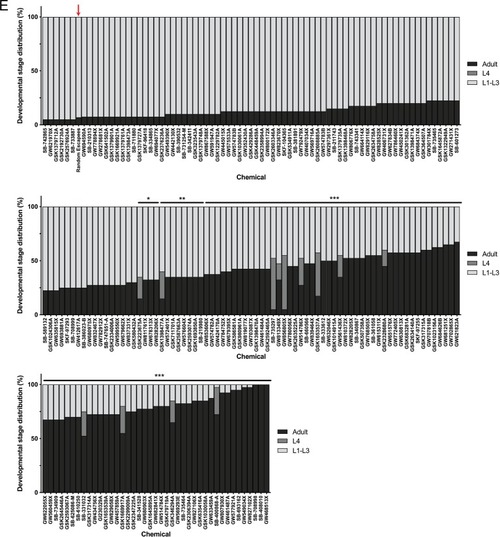
It is important to note that this was performed with the assumption that 20 worms were in each well as a means of estimating the proportion of actual L4 and adult counts in each well. In other words, we assumed #L1-L3 larvae = 20 – (#L4 + #adult). Plots shown are from independent screens of ( |
( |
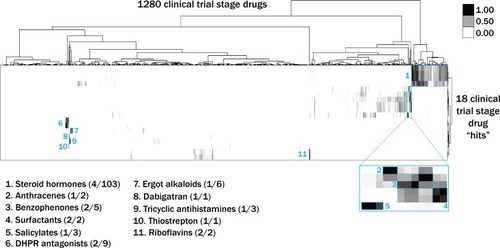
Tanimoto scores were calculated for each pair of compounds as a measure of structural similarity and similar clusters were identified via hierarchical clustering of Tanimoto scores (legend indicates the Tanimoto score). As shown, chemicals with similar molecular fingerprints are associated with similar annotated functions/targets. Fisher’s exact test was used to determine enrichment based on the number of structurally similar members in each cluster that were either hits or not hits out of the total number of the compounds in the library. |
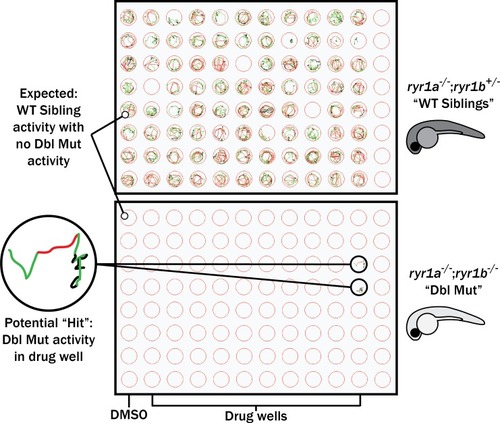
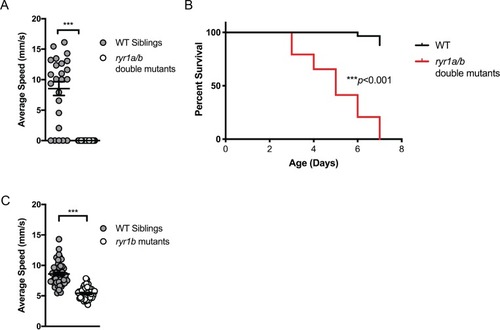
Schematic of our zebrafish screen methodology showing the expected motility of unaffected siblings (‘WT Siblings’) and double mutants (‘Dbl Mut’) and expected motility of immotile double mutants if a chemical suppressed the phenotype. We did not identify any suppressors of the double mutant phenotype |
( |
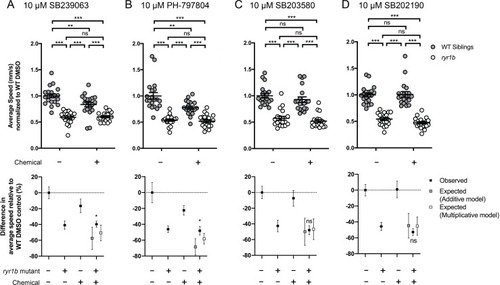
Compared to the average speed of DMSO WT controls, treatment with (A) SB239063 and (B) PH-797804 reduced the average speed of WT siblings while the expected decrease in movement speed in treated ryr1b was not observed. The difference in average speed of ryr1b+p38 inhibitor compared to WT controls (i.e. WT siblings+DMSO vehicle) is higher than expected given the effects of genotype and chemical alone, indicative of a positive chemical-genetic interaction. Chemical-genetic interactions were not observed for p38 inhibitors (C) SB203580 and (D) SB202190. Data are presented as mean ± SEM movement speed (mm/s) normalized to DMSO-treated WT siblings for n = 2 independent experiments. Statistical analysis by two-way ANOVA followed by Tukey’s multiple comparisons post-test. *p<0.05, **p<0.01, ***p<0.001; Sample size n = 19 or 20 for each treatment group in a set. |
Compared to the average speed of DMSO WT controls, treatment with ( |
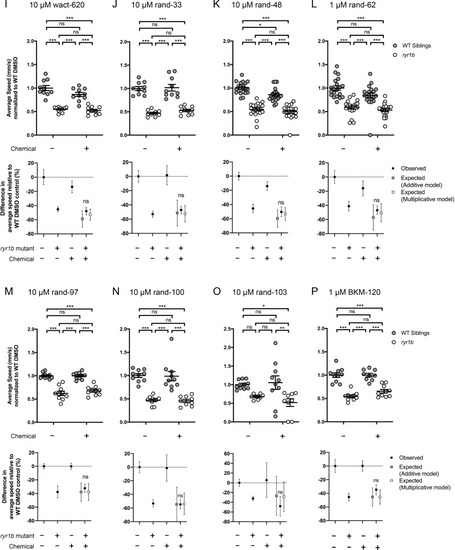
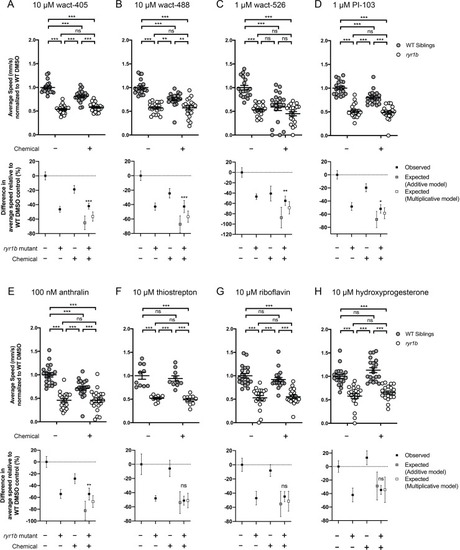
Compared to the average speed of DMSO WT controls, chemical-genetic interactions were not observed for 18 hits from the |
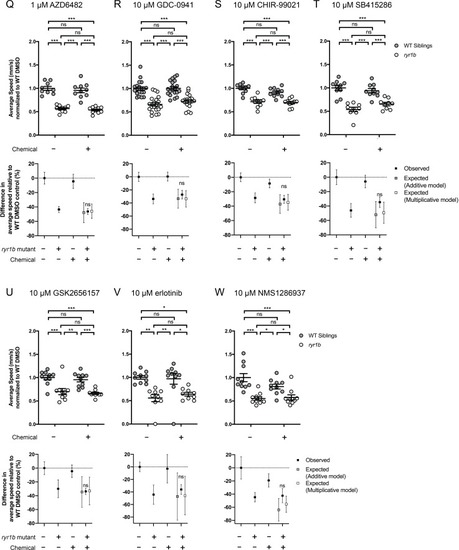
Compared to the average speed of DMSO WT controls, chemical-genetic interactions were not observed for 18 hits from the |
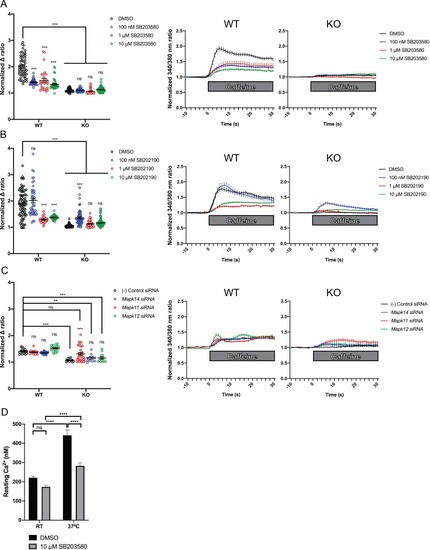
Ratiometric fura-2 imaging with 10 mM caffeine induction after treatment with p38 inhibitors (A) SB203580 (# of myotubes from left-right: n = 56, 30, 28, 43, 45, 57, 46, 79) and (B) SB202190 (n = 78, 44, 25, 45, 50, 58, 50, 142) or after (C) siRNA targeting p38α (Mapk14), p38β (Mapk11), and p38γ (Mapk12) (n = 17, 27,18, 23, 11, 11, 33, 13). Panels on the left show the peak change in calcium concentration within 30 s of adding caffeine normalized to the average of 10 s of baseline resting free Ca2+ concentration ([Ca2+]i), that is normalized Δ ratio, while plots on the right show calcium levels normalized to [Ca2+]i after addition of caffeine. This data shows that p38 inhibition or knockdown impairs Ca2+ release in wild type myotubes while promoting some Ca2+ release in Ryr1 knockout cells. Note: labels directly above each group indicate the statistical significance compared to DMSO control within the same genotype. Data are presented as mean ± SEM derived from Ca2+ measurements of individual myotubes (Figure 5—figure supplement 3A–C). Corresponding plots showing [Ca2+]i levels without normalization are also provided (Figure 5—figure supplement 4D–F). Statistical analysis by two-way ANOVA followed by Tukey’s multiple comparisons post-test where *p<0.05, **p<0.01, ***p<0.001. (D) Overnight treatment of myotubes from Y522S mutant mice with 10 μM SB203580 significantly reduced a temperature-dependent increase in resting Ca2+ concentration. |
( |
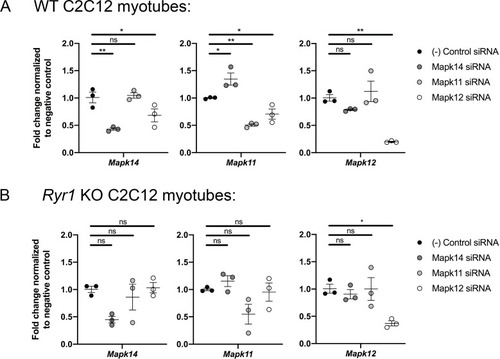
As shown, the siRNAs reduce target gene expression by >50% in WT cells ( |
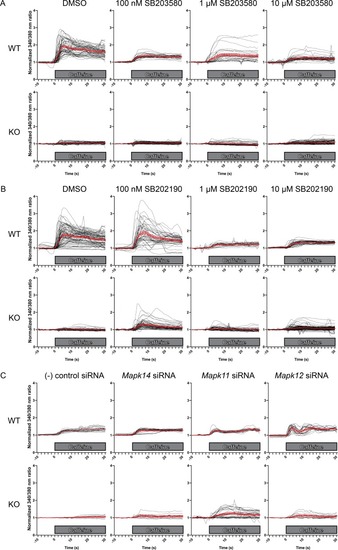
Ratiometric fura-2 imaging with 10 mM caffeine induction after treatment with A) SB203580, ( |
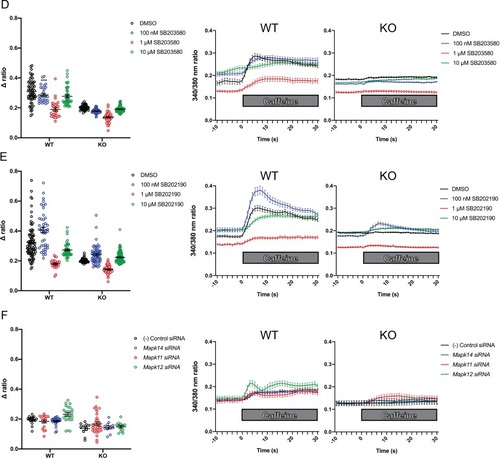
Ratiometric fura-2 imaging with 10 mM caffeine induction after treatment with D) SB203580, ( |