
FIGURE
Figure 2-figure supplement 2
- ID
- ZDB-FIG-200511-26
- Publication
- Volpatti et al., 2020 - Identification of drug modifiers for RYR1 related myopathy using a multi-species discovery pipeline
- Other Figures
-
- Figure 1
- Figure 2
- Figure 2-figure supplement 1
- Figure 2-figure supplement 2
- Figure 2-figure supplement 3
- Figure 2-figure supplement 4
- Figure 2-figure supplement 5
- Figure 3
- Figure 3-figure supplement 1
- Figure 4
- Figure 4-figure supplement 1
- Figure 4-figure supplement 2
- Figure 4-figure supplement 3
- Figure 5
- Figure 5-figure supplement 1
- Figure 5-figure supplement 2
- Figure 5-figure supplement 3
- Figure 5-figure supplement 4
- All Figure Page
- Back to All Figure Page
Figure 2-figure supplement 2
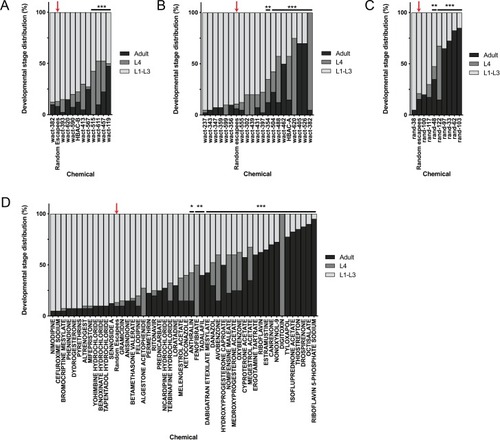
It is important to note that this was performed with the assumption that 20 worms were in each well as a means of estimating the proportion of actual L4 and adult counts in each well. In other words, we assumed #L1-L3 larvae = 20 – (#L4 + #adult). Plots shown are from independent screens of ( |
Expression Data
Expression Detail
Antibody Labeling
Phenotype Data
Phenotype Detail
Acknowledgments
This image is the copyrighted work of the attributed author or publisher, and
ZFIN has permission only to display this image to its users.
Additional permissions should be obtained from the applicable author or publisher of the image.
Full text @ Elife