
Figure 4-figure supplement 3
- ID
- ZDB-FIG-200511-35
- Publication
- Volpatti et al., 2020 - Identification of drug modifiers for RYR1 related myopathy using a multi-species discovery pipeline
- Other Figures
-
- Figure 1
- Figure 2
- Figure 2-figure supplement 1
- Figure 2-figure supplement 2
- Figure 2-figure supplement 3
- Figure 2-figure supplement 4
- Figure 2-figure supplement 5
- Figure 3
- Figure 3-figure supplement 1
- Figure 4
- Figure 4-figure supplement 1
- Figure 4-figure supplement 2
- Figure 4-figure supplement 3
- Figure 5
- Figure 5-figure supplement 1
- Figure 5-figure supplement 2
- Figure 5-figure supplement 3
- Figure 5-figure supplement 4
- All Figure Page
- Back to All Figure Page
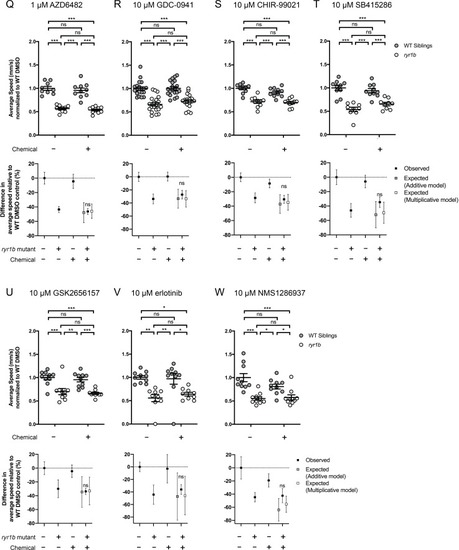
Compared to the average speed of DMSO WT controls, chemical-genetic interactions were not observed for 18 hits from the |