
|
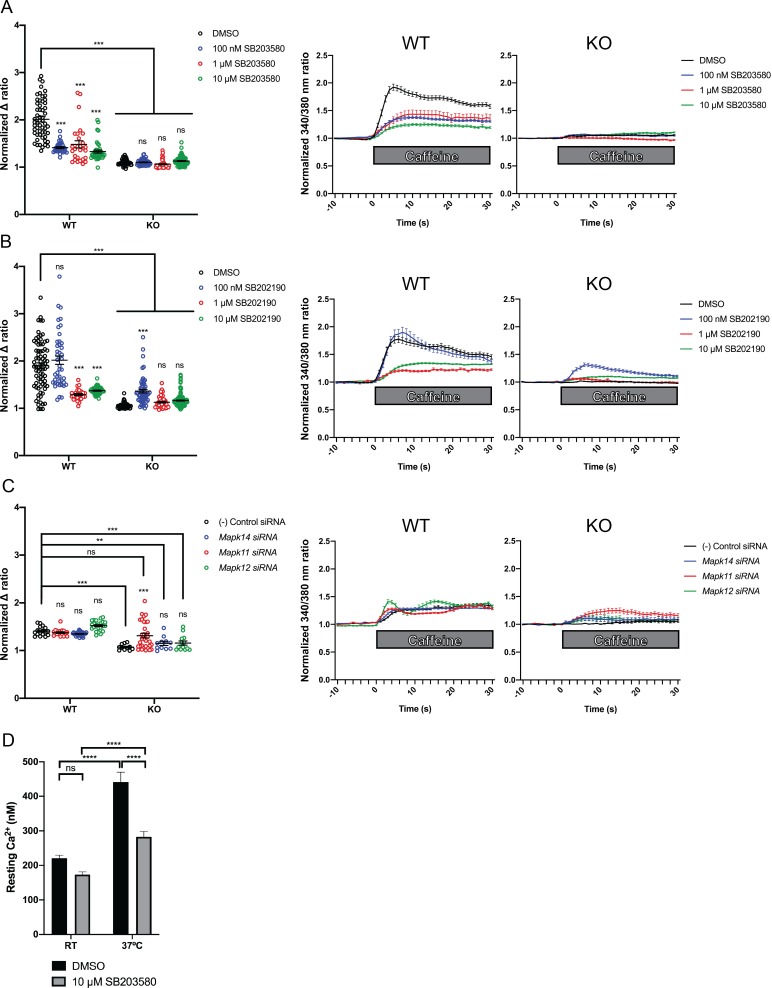
Figure 5 Ratiometric fura-2 imaging with 10 mM caffeine induction after treatment with p38 inhibitors (A) SB203580 (# of myotubes from left-right: n = 56, 30, 28, 43, 45, 57, 46, 79) and (B) SB202190 (n = 78, 44, 25, 45, 50, 58, 50, 142) or after (C) siRNA targeting p38α (Mapk14), p38β (Mapk11), and p38γ (Mapk12) (n = 17, 27,18, 23, 11, 11, 33, 13). Panels on the left show the peak change in calcium concentration within 30 s of adding caffeine normalized to the average of 10 s of baseline resting free Ca2+ concentration ([Ca2+]i), that is normalized Δ ratio, while plots on the right show calcium levels normalized to [Ca2+]i after addition of caffeine. This data shows that p38 inhibition or knockdown impairs Ca2+ release in wild type myotubes while promoting some Ca2+ release in Ryr1 knockout cells. Note: labels directly above each group indicate the statistical significance compared to DMSO control within the same genotype. Data are presented as mean ± SEM derived from Ca2+ measurements of individual myotubes (Figure 5—figure supplement 3A–C). Corresponding plots showing [Ca2+]i levels without normalization are also provided (Figure 5—figure supplement 4D–F). Statistical analysis by two-way ANOVA followed by Tukey’s multiple comparisons post-test where *p<0.05, **p<0.01, ***p<0.001. (D) Overnight treatment of myotubes from Y522S mutant mice with 10 μM SB203580 significantly reduced a temperature-dependent increase in resting Ca2+ concentration.