FIGURE SUMMARY
Title

A network-based approach to identify deregulated pathways and drug effects in metabolic syndrome

Authors
Misselbeck, K., Parolo, S., Lorenzini, F., Savoca, V., Leonardelli, L., Bora, P., Morine, M.J., Mione, M.C., Domenici, E., Priami, C.
Source
Full text @ Nat. Commun.

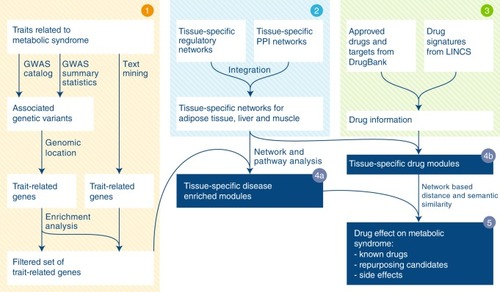
Schematic illustration of the computational framework. Step 1 MetSyn-related genes are identified by combining GWAS results and literature findings followed by a filtering step based on gene-set enrichment analysis. Step 2 Tissue-specific networks are constructed by integrating transcriptional regulatory networks from23 and PPI networks from HIPPIE db25. Step 3 Drug information is retrieved from DrugBank29 and LINCS database11. Step 4a and b Tissue-specific MetSyn and drug modules are established using network analysis. Step 5 To measure drug effects, a proximity score between drug and MetSyn modules is computed on the basis of network distance and semantic similarity

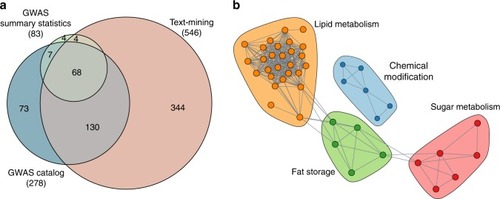
Identification of MetSyn-related genes. a Venn diagram showing the overlap among MetSyn genes identified using GWAS catalog, GWAS summary statistics and text mining. See also Supplementary Fig. 2 and Supplementary Data 3. b Pathway enrichment map showing shared gene content among the pathways enriched in MetSyn genes. Each node corresponds to a pathway and edges between pathways indicate the presence of shared genes. Colors identify the membership to communities as detected by random walk clustering algorithm. See also Supplementary Data 2

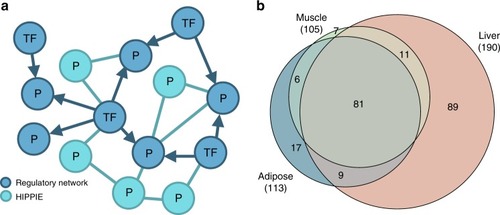
Network construction and disease module identification. a Tissue-specific networks were constructed by integrating transcriptional regulatory networks consisting of interactions between transcription factors and genes (blue nodes) and PPI networks including interactions among proteins (turquoise nodes). For each tissue, the integrated network was built starting from the high-evidence associations from the regulatory network and extended with high-score interactions from the PPI network. b Venn diagram of shared MetSyn genes among the three tissue-specific networks. See also Supplementary Data 4

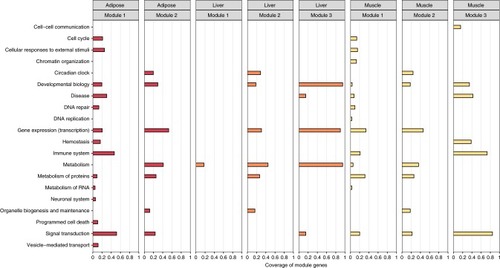
Functional annotation of the disease modules. For each network and disease module the coverage of module genes by significantly enriched Reactome pathways, grouped according to the TopLevel pathway classification, is presented. See also Supplementary Data 5

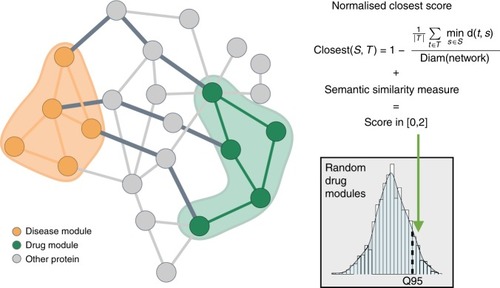
Illustration of the score calculation to evaluate the drug-disease interplay. The score combines network distances and functional similarity between proteins in the drug module (green nodes) and proteins in the disease module (orange nodes). The network score assesses the shortest path lengths connecting each protein of the drug module to the nearest protein in the disease module (dark gray edges) while the semantic similarity measure evaluates the functional similarity between the modules. To test the score significance, the distance between drug and disease modules is compared to a reference distribution of scores computed with drug modules randomly chosen from the network

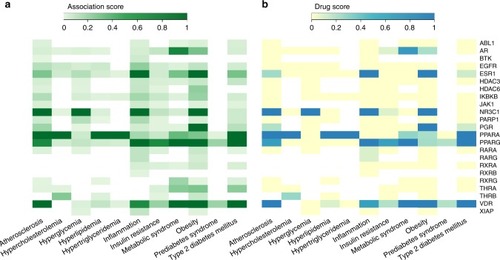
Association between the active drug targets in the adipose network and MetSyn-related traits based on the scores provided by OpenTargets. a Heatmap of total association score and b heatmap of association score based on ChEMBL information about drugs approved for marketing by FDA or under evaluation in clinical trials. Source data are provided as a Source Data file

BTK expression in public datasets. a Boxplots showing BTK gene expression in macrophages of diabetic and non-diabetic subjects. The points represent the single values while the black tick lines indicate the median values and the dotted lines indicate the mean values. b Bar charts showing the gene expression level of Btk in adipose tissue for wild type and GPR120 KO mice fed with normal diet (ND) or high fat diet (HFD). The charts represent the mean of n = 3 replicates. The error bars indicate the min-max interval. c Bar charts showing the gene expression level of Btk in adipose tissue for wild-type, Caspase 1 null and ASC1 null mice. The charts represent the mean of n = 3 replicates for Caspase 1 null and ASC1 null mice and n = 4 for wild type mice. The error bars indicate the min-max interval. d Estimated relative fraction of different immune cells in adipose tissue calculated via Cibersort for wild type and GPR120 KO mice fed with normal diet (ND) or high fat diet (HFD) in adipose tissue. In a-c, statistical significance is denoted as follows: ns: not significant (p-value > 0.05), *:0.01 < p-value < = 0.05, **:0.01 < = p-value < 0.001 (Student’s t test). Source data are provided as a Source Data file

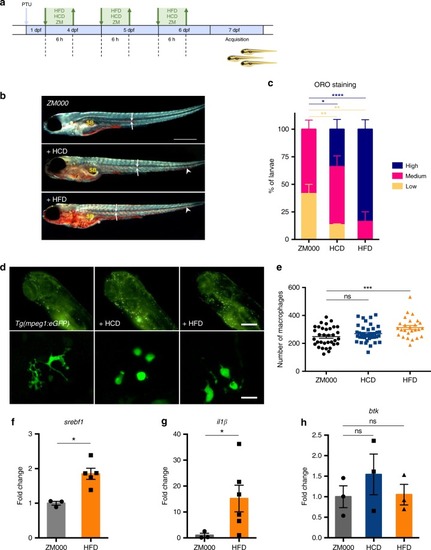
High fat diet induces lipid and macrophage accumulation in zebrafish. a Schematic representation of the protocol used for the experiments. Zebrafish larvae were fed with high fat (HFD), high cholesterol (HCD) or standard (ZM) diet for 6 h each day from day 4 to day 6 post fertilization (dpf). PTU: 1-phenyl 2-thiourea. b 7 dpf Casper zebrafish larvae, fixed and stained with Oil Red O: representative low (i), medium (ii), and high (iii) staining levels un larvae fed with the indicated diet are shown. SB: swim bladder. Arrows point to lipids in blood vessels; arrowheads point to lipid droplets in the tail region; asterisks indicate the intestine. Dark-field images, calibration bar: 500 μm. c Percentage of larvae with high, medium and low lipid accumulation for the three indicated diets. Data are pooled from two experiments (n > 12) and the charts show the mean ± SEM. Blue asterisks refer to statistics of low stained larvae, red asterisks refer to statistics of high stained larvae. ****p-value < 0.0001, **p-value < 0.01, *p-value < 0.05 (two-way ANOVA test). d Representative fluorescent images of the head + yolk regions of larvae obtained using the Operetta system (i–iii—calibration bar: 100 μm) and the confocal microscope (i′–iii″—calibration bar: 20 μm). e Quantification of macrophages for the three considered diets. fh Quantitative PCR analysis of the expression of sterol regulatory element binding transcription factor 1 (srebf1), interleukin-1 beta (il1β) and bruton tyrosine kinase (btk) in larvae fed and treated as indicated. In e data are pooled from three or more experiments (n > = 26) and **p-value < 0.01, *p-value < 0.05 (Mann–Whitney test). Source data are provided as a Source Data file

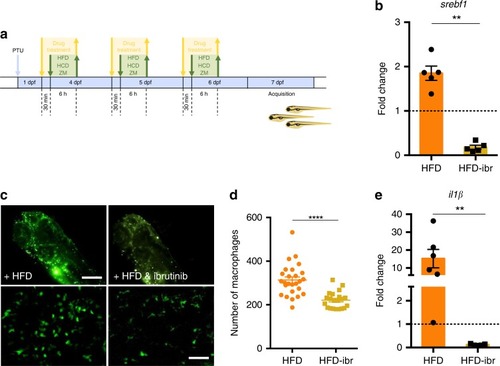
High fat diet effects can be prevented by ibrutinib treatment. a Schematic representation of the protocol used for ibrutinib treatment. Zebrafish larvae were treated with 5 μM ibrutinib 30 min before and during each feeding period. b Quantitative PCR analysis of the expression of srebf1 in larvae fed and treated as indicated. The error bars show the standard error of the mean (SEM); **p-value < 0.01, n = 5 (Mann–Whitney test). c Representative images of the macrophages from the head + yolk regions of larvae obtained using the Operetta without (i) and with treatment (ii). Calibration bar: 100 μm. In i′-ii″ the macrophages are shown at higher magnification (calibration bars: 50 μm). d Quantification of fluorescent macrophages in HFD-fed larvae without and with ibrutinib treatment. Data are pooled from three or more experiments (n > = 21) and the charts show the mean ± the standard error of the mean (SEM). **p-value < 0.01 (Student’s t-test). e Quantitative PCR analysis of interleukin-1β (il1β) expression in larvae fed and treated as indicated. **p-value < 0.01 (Mann–Whitney test). Source data are provided as a Source Data file

ZFIN is incorporating published figure images and captions as part of an ongoing project. Figures from some publications have not yet been curated, or are not available for display because of copyright restrictions.

ZFIN is incorporating published figure images and captions as part of an ongoing project. Figures from some publications have not yet been curated, or are not available for display because of copyright restrictions.

Acknowledgments
This image is the copyrighted work of the attributed author or publisher, and ZFIN has permission only to display this image to its users. Additional permissions should be obtained from the applicable author or publisher of the image. Full text @ Nat. Commun.