
|
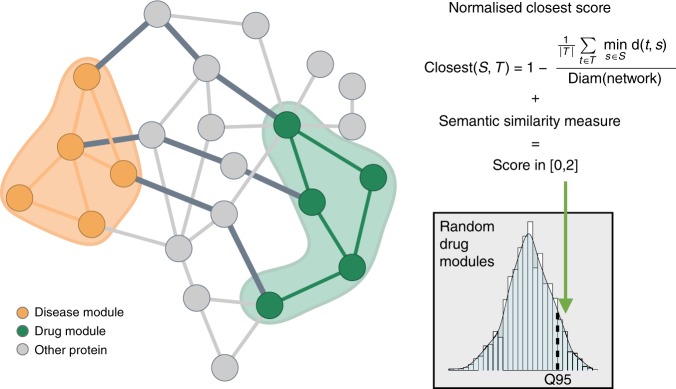
Fig. 5
Illustration of the score calculation to evaluate the drug-disease interplay. The score combines network distances and functional similarity between proteins in the drug module (green nodes) and proteins in the disease module (orange nodes). The network score assesses the shortest path lengths connecting each protein of the drug module to the nearest protein in the disease module (dark gray edges) while the semantic similarity measure evaluates the functional similarity between the modules. To test the score significance, the distance between drug and disease modules is compared to a reference distribution of scores computed with drug modules randomly chosen from the network