FIGURE

Fig. 3

ID
ZDB-FIG-191230-877
Publication
Misselbeck et al., 2019 - A network-based approach to identify deregulated pathways and drug effects in metabolic syndrome
Other Figures
All Figure Page
Back to All Figure Page
Fig. 3

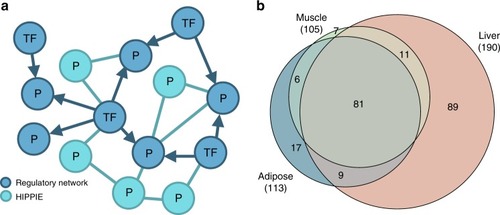
Network construction and disease module identification. a Tissue-specific networks were constructed by integrating transcriptional regulatory networks consisting of interactions between transcription factors and genes (blue nodes) and PPI networks including interactions among proteins (turquoise nodes). For each tissue, the integrated network was built starting from the high-evidence associations from the regulatory network and extended with high-score interactions from the PPI network. b Venn diagram of shared MetSyn genes among the three tissue-specific networks. See also Supplementary Data 4

Expression Data

Expression Detail
Antibody Labeling
Phenotype Data

Phenotype Detail
Acknowledgments
This image is the copyrighted work of the attributed author or publisher, and ZFIN has permission only to display this image to its users. Additional permissions should be obtained from the applicable author or publisher of the image. Full text @ Nat. Commun.