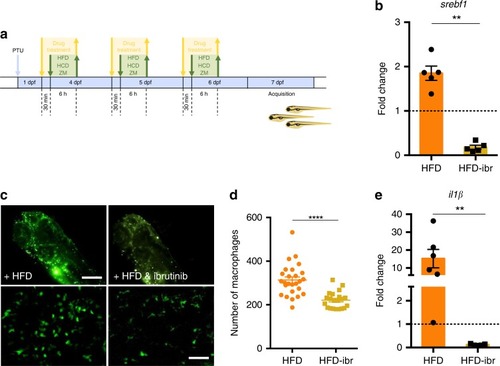
High fat diet effects can be prevented by ibrutinib treatment. a Schematic representation of the protocol used for ibrutinib treatment. Zebrafish larvae were treated with 5 μM ibrutinib 30 min before and during each feeding period. b Quantitative PCR analysis of the expression of srebf1 in larvae fed and treated as indicated. The error bars show the standard error of the mean (SEM); **p-value < 0.01, n = 5 (Mann–Whitney test). c Representative images of the macrophages from the head + yolk regions of larvae obtained using the Operetta without (i) and with treatment (ii). Calibration bar: 100 μm. In i′-ii″ the macrophages are shown at higher magnification (calibration bars: 50 μm). d Quantification of fluorescent macrophages in HFD-fed larvae without and with ibrutinib treatment. Data are pooled from three or more experiments (n > = 21) and the charts show the mean ± the standard error of the mean (SEM). **p-value < 0.01 (Student’s t-test). e Quantitative PCR analysis of interleukin-1β (il1β) expression in larvae fed and treated as indicated. **p-value < 0.01 (Mann–Whitney test). Source data are provided as a Source Data file
|
