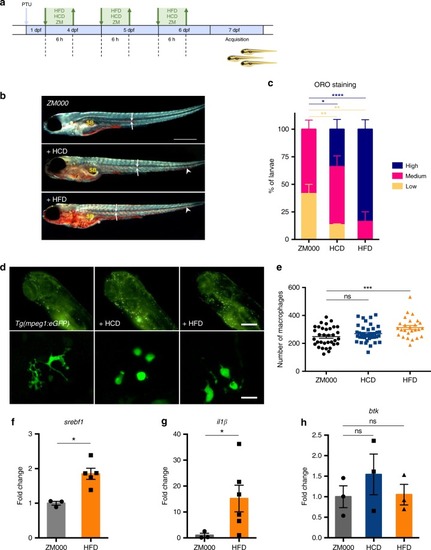
High fat diet induces lipid and macrophage accumulation in zebrafish. a Schematic representation of the protocol used for the experiments. Zebrafish larvae were fed with high fat (HFD), high cholesterol (HCD) or standard (ZM) diet for 6 h each day from day 4 to day 6 post fertilization (dpf). PTU: 1-phenyl 2-thiourea. b 7 dpf Casper zebrafish larvae, fixed and stained with Oil Red O: representative low (i), medium (ii), and high (iii) staining levels un larvae fed with the indicated diet are shown. SB: swim bladder. Arrows point to lipids in blood vessels; arrowheads point to lipid droplets in the tail region; asterisks indicate the intestine. Dark-field images, calibration bar: 500 μm. c Percentage of larvae with high, medium and low lipid accumulation for the three indicated diets. Data are pooled from two experiments (n > 12) and the charts show the mean ± SEM. Blue asterisks refer to statistics of low stained larvae, red asterisks refer to statistics of high stained larvae. ****p-value < 0.0001, **p-value < 0.01, *p-value < 0.05 (two-way ANOVA test). d Representative fluorescent images of the head + yolk regions of larvae obtained using the Operetta system (i–iii—calibration bar: 100 μm) and the confocal microscope (i′–iii″—calibration bar: 20 μm). e Quantification of macrophages for the three considered diets. f–h Quantitative PCR analysis of the expression of sterol regulatory element binding transcription factor 1 (srebf1), interleukin-1 beta (il1β) and bruton tyrosine kinase (btk) in larvae fed and treated as indicated. In e data are pooled from three or more experiments (n > = 26) and **p-value < 0.01, *p-value < 0.05 (Mann–Whitney test). Source data are provided as a Source Data file
|
