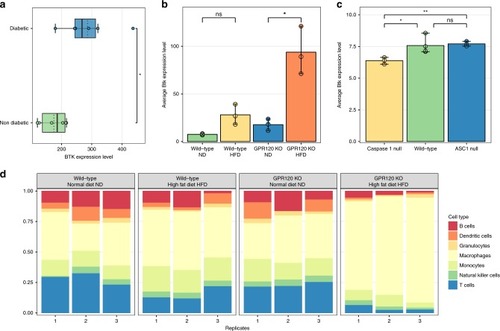
BTK expression in public datasets. a Boxplots showing BTK gene expression in macrophages of diabetic and non-diabetic subjects. The points represent the single values while the black tick lines indicate the median values and the dotted lines indicate the mean values. b Bar charts showing the gene expression level of Btk in adipose tissue for wild type and GPR120 KO mice fed with normal diet (ND) or high fat diet (HFD). The charts represent the mean of n = 3 replicates. The error bars indicate the min-max interval. c Bar charts showing the gene expression level of Btk in adipose tissue for wild-type, Caspase 1 null and ASC1 null mice. The charts represent the mean of n = 3 replicates for Caspase 1 null and ASC1 null mice and n = 4 for wild type mice. The error bars indicate the min-max interval. d Estimated relative fraction of different immune cells in adipose tissue calculated via Cibersort for wild type and GPR120 KO mice fed with normal diet (ND) or high fat diet (HFD) in adipose tissue. In a-c, statistical significance is denoted as follows: ns: not significant (p-value > 0.05), *:0.01 < p-value < = 0.05, **:0.01 < = p-value < 0.001 (Student’s t test). Source data are provided as a Source Data file
|
