IMAGE

Fig. 1

ID
ZDB-IMAGE-191230-895
Source
Figures for Misselbeck et al., 2019
Image
Figure Caption

Fig. 1

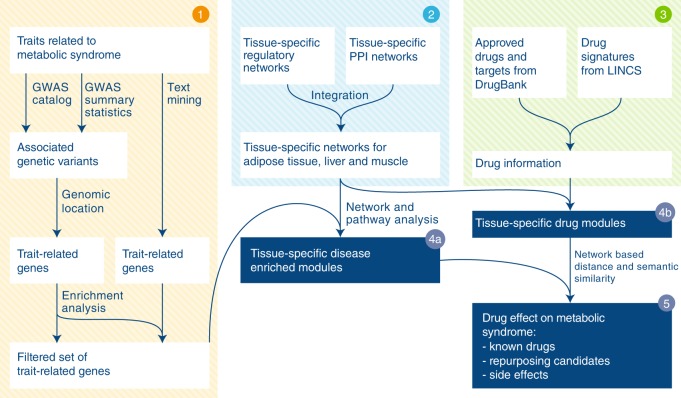
Schematic illustration of the computational framework. Step 1 MetSyn-related genes are identified by combining GWAS results and literature findings followed by a filtering step based on gene-set enrichment analysis. Step 2 Tissue-specific networks are constructed by integrating transcriptional regulatory networks from23 and PPI networks from HIPPIE db25. Step 3 Drug information is retrieved from DrugBank29 and LINCS database11. Step 4a and b Tissue-specific MetSyn and drug modules are established using network analysis. Step 5 To measure drug effects, a proximity score between drug and MetSyn modules is computed on the basis of network distance and semantic similarity

Acknowledgments
This image is the copyrighted work of the attributed author or publisher, and ZFIN has permission only to display this image to its users. Additional permissions should be obtained from the applicable author or publisher of the image. Full text @ Nat. Commun.