FIGURE SUMMARY
Title

ADP-dependent glucokinase regulates energy metabolism via ER-localized glucose sensing

Authors
Imle, R., Wang, B.T., Stützenberger, N., Birkenhagen, J., Tandon, A., Carl, M., Himmelreich, N., Thiel, C., Gröne, H.J., Poschet, G., Völkers, M., Gülow, K., Schröder, A., Carillo, S., Mittermayr, S., Bones, J., Kamiński, M.M., Kölker, S., Sauer, S.W.
Source
Full text @ Sci. Rep.

ZFIN is incorporating published figure images and captions as part of an ongoing project. Figures from some publications have not yet been curated, or are not available for display because of copyright restrictions.

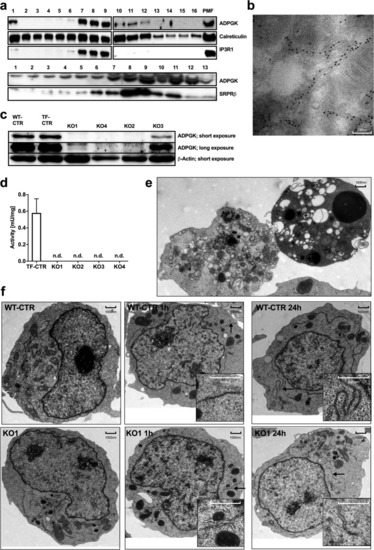
ADPGK is localized in ER lumen and important for ER biogenesis. (a) Representative immunoblots of density gradient-enriched ER fractions from Jurkat T cells, stained for ADPGK and different ER-markers (IP3R-1, Inositol-1,4,5-triphosphate receptor; SRPRβ, signal recognition particle receptor subunit β; PMF, post-mitochondrial fraction). N = 4 independent experiments. (b) Representative electron micrograph of ADPGK-GFP expressing HEK cells, stained with gold particle-labeled anti-GFP antibodies. (c) Representative immunoblots of ADPGK protein in Jurkat T cell knockout using β-Actin as a loading control. N = 5 independent experiments. (d) ADPGK activity assays in KO clones normalized to protein content. N = 7 independent experiments. (e) Electron micrographs of KO1 cells stimulated with PMA (10 ng/ml) and Ionomycin (10 µM) for 24 h. Dying cells show features of autophagy (left) and apoptosis (right). (f) Electron micrographs of KO1 and WT-CTR cells stimulated with PMA (10 ng/ml) and Ionomycin (10 µM) for 0 h, 1 h, and 24 h. Stimulation results in extended ER networks in control cells and short, dilated ER structures in KO1 cells. Black arrows indicate magnified structures. All images of blots represent cropped blots of appropriate protein size. For full length blots see Supplemental Fig. 3.

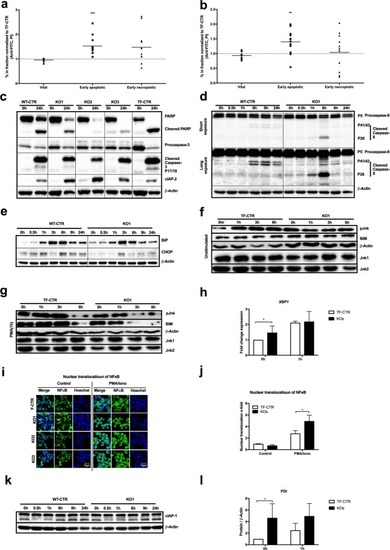
ADPGK knockout leads to apoptosis and ER stress. (a - c) Cytometric cell death analysis using propidium iodide (PI) and annexin V (AnV) staining in control and ADPGK KO cells (a) without stimulation and treated with (b) PMA/Ionomycin for 24 h. Individual ratios (dots) and median (line) are shown. N = 4 independent experiments; vital (AnV-/PI-), early apoptotic (AnV+/PI−), early necroptotic (AV−/PI+). (c) Representative immunoblot analysis of PARP-cleavage, caspase 3-cleavage and cIAP2 expression under basal conditions and after 24 h stimulation with PMA/Iono. (d) Expression and cleavage of caspase 8 and (e) expression of the ER stress marker proteins CHOP and BiP in control and KO1 cells upon different activation periods with PMA/Iono. (f,g) Immunoblotting for phospho-Jnk and Bim expression upon addition of the protein synthesis inhibitor cycloheximide (20 µg/ml) for 0, 1, 3 and 6 hours (g) without and with (h) PMA pre-stimulation (1 h). For normalization β-actin and for baseline Jnk-expression Jnk1/2 are shown. (h) RT-qPCR-analysis of spliced XBP1 with and without 1 h PMA/Iono stimulation. N = 3 independent experiments. (i,j) Nuclear translocation of NFκB upon PMA/Iono stimulation shown as (i) representative confocal single-plane micrographs stained for NfkB and nuclear counterstaining with Hoechst dye alongside (j) quantification plot. N = 3 independent experiments. (k) Immunoblots of cIAP-1 in control and KO1 cells upon different periods of stimulation with PMA/Iono. (l) Immunoblot analysis of PDI expression in control and ADPGK KO cells with and without 1 h PMA stimulation. All immunoblots are representative images of N = 3 independent experiments. If not stated otherwise, mean of CTRs (TF-CTR and WT-CTR) and KOs (KO1, KO2, KO3) are shown. In all experiments stimulation was induced as described in the text using 10 ng/mL PMA and 10 µM Ionomycin. * p < 0.05, ** p < 0.01, ***p < 0.001. All images of blots represent cropped blots of appropriate protein size. For full length blots see Supplemental Fig. 3.

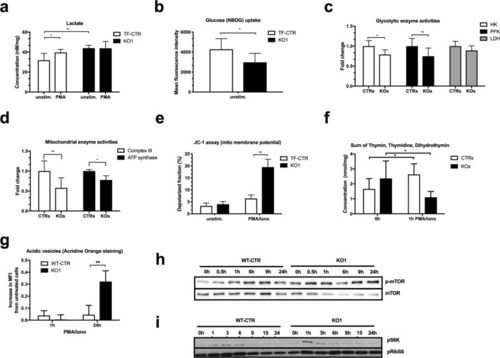
ADPGK regulates energy metabolism. (a) Lactate concentrations (n = 4 independent experiments) and (b) glucose uptake (in 1 hour; n = 3 independent experiments) in control and KO1 cells. (c) Changes of enzymatic activities of Hexokinase (HK), Phosphofructokinase (PFK) and Lactate dehydrogenase (LDH) in ADPGK KO clones compared to control cells. N = 3 independent experiments. (d) Changes of respiratory chain complex III and ATP synthase activities in ADPGK KO clones compared to control cells. N = 3 independent experiments. (e) Mitochondrial membrane potential measured in control and ADPGK KO cells after 24 h stimulation with PMA/Iono using JC-1 dye. N = 3 independent experiments. (f) Sum of thymidine degradation intermediates (thymin, thymidine, dihydrothymine) in lysates of control and ADPGK KO cells treated with PMA/Iono for 0 h or 1 h. N = 3 independent experiments. (g) Acridine Orange staining of control and KO1 cells upon 1 h and 24 h PMA/Iono stimulation. N = 3 independent experiments. (h) Representative immunoblots for mTOR phosphorylation after different PMA/Iono activation periods of control and KO1 cells. N = 3 independent experiments. (i) Immunoblots of pS6K and pRibS6 after different PMA/Iono activation periods in control and KO1 cells. In all experiments stimulation was induced as described in the text using 10 ng/mL PMA and 10 µM Ionomycin. *p < 0.05, **p < 0.01. All images of blots represent cropped blots of appropriate protein size. For full length blots see Supplemental Fig. 3.

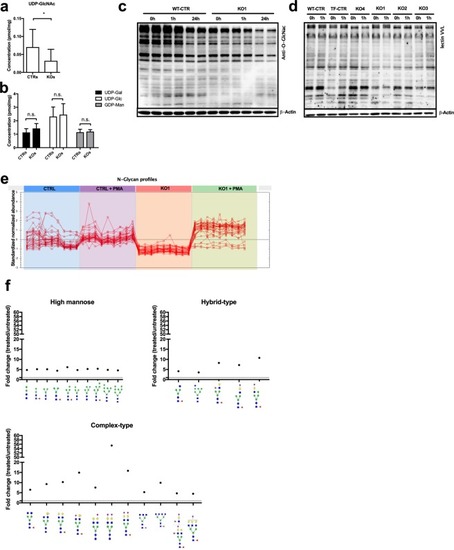
ADPGK finetunes glucose flux into O- and N-glycosylation. (a,b) Sugar precursors (UDP-GlcNAc, UDP-Gal, UDP-Glc, GDP-Man) of glycosylation. N = 4 independent experiments. (c, d) Representative immunoblots for GlcNAc-residues via monoclonal antibody against (c) O-GlcNAc and (d) the lectin VVL in lysates of control and ADPGK KO cells stimulated with PMA for different time periods. N = 3 independent experiments. (e) Abundance profile of changes in N-glycans in control and KO1 cells upon 24 h PMA/Iono stimulation and (f) scheme of changes in high mannose glycans, complex- and hybrid-type glycans in KO1 cells upon 24 h PMA/Iono activation analyzed via HILIC-FLR-MS. Mean of CTRs (TF-CTR and WT-CTR) and KOs (KO1, KO2, KO3) are shown. In all experiments stimulation was induced as described in the text using 10 ng/mL PMA and 10 µM Ionomycin. *p < 0.05. All images of blots represent cropped blots of appropriate protein size. For full length blots see Supplemental Fig. 3.

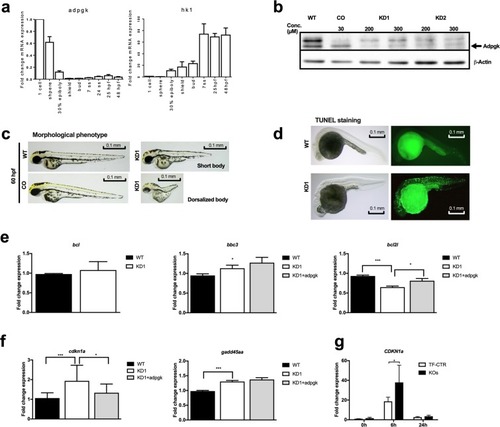
Knockdown of Adpgk in embryonic zebrafish results in aberrant body axis development and cell death. (a) RT-qPCR analysis of adpgk and hexokinase 1 (hk1) expression in wild type embryos collected at different developmental stages. N = 4 independent experiments. (b) Immunoblotting of Adpgk after blocking correct splicing (KD1) or translation (KD2) of adpgk mRNA by morpholino (MO) technology in zebrafish embryos, compared to wild type and control MO treated animals. Representative images, N = 3 independent experiments. (c) Representative images of aberrant body axis development in KD1 zebrafish ranging from shortened body to strong dorsalization (stage 60 hpf; lateral views with anterior to the left). Hypomorphic zebrafish are compared to age matched wild type and control MO treated animals. (d) Representative images of TUNEL staining in wild type and KD1 embryos (stage 22 hpf; lateral views with anterior to the left). (e) RT-qPCR analysis of bcl, bbc3 and bcl2l expression in wild type and KD1 embryos as wells as KD1 embryos rescued with adpgk mRNA (stage 8 hpf). N = 5 independent experiments. (f) RT-qPCR analysis of the cell cycle checkpoint genes cdkn1a and gadd45aa in wild type and KD1 embryos as well as KD1 embryos rescued with adpgk mRNA (stage 8 hpf). N = 5 independent experiments. (i) RT-qPCR analysis of CDKN1A expression in control and ADPGK-deficient Jurkat T cells after different periods of stimulation with and without PMA. N = 3 independent experiments. * p < 0.05, ** p < 0.01, ***p < 0.005. All images of blots represent cropped blots of appropriate protein size. For full length blots see Supplemental Fig. 3.

EXPRESSION / LABELING:
Genes:
Fish:
Knockdown Reagent:
Anatomical Term:
Stage Range: 1-cell to Long-pec

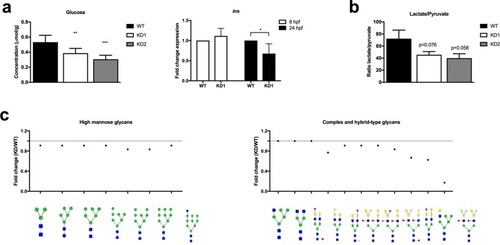
Adpgk regulates glucose metabolism in zebrafish embryos. (a) Quantification of whole body glucose content and insulin expression in wild type, KD1, and KD2 embryos. N = 6 independent experiments, stage 22 hpf. (b) Ratio of lactate to pyruvate in wild type, KD1, and KD2 embryos. N = 3 independent experiments, stage 22 hpf. (c) Scheme of changes in high mannose glycans, complex- and hybrid-type glycans in KD1 compared to control embryos (stage 22 hpf) analyzed by HILIC-FLR-MS. * p < 0.05, ** p < 0.01, ***p < 0.005.

EXPRESSION / LABELING:
Gene:
Fish:
Knockdown Reagent:
Anatomical Term:
Stage: Prim-5
PHENOTYPE:
Fish:
Knockdown Reagents:
Observed In:
Stage Range: 26+ somites to Prim-5
Acknowledgments
This image is the copyrighted work of the attributed author or publisher, and ZFIN has permission only to display this image to its users. Additional permissions should be obtained from the applicable author or publisher of the image. Full text @ Sci. Rep.