IMAGE

Figure 2

ID
ZDB-IMAGE-191230-820
Source
Figures for Imle et al., 2019
Image
Figure Caption

Figure 2

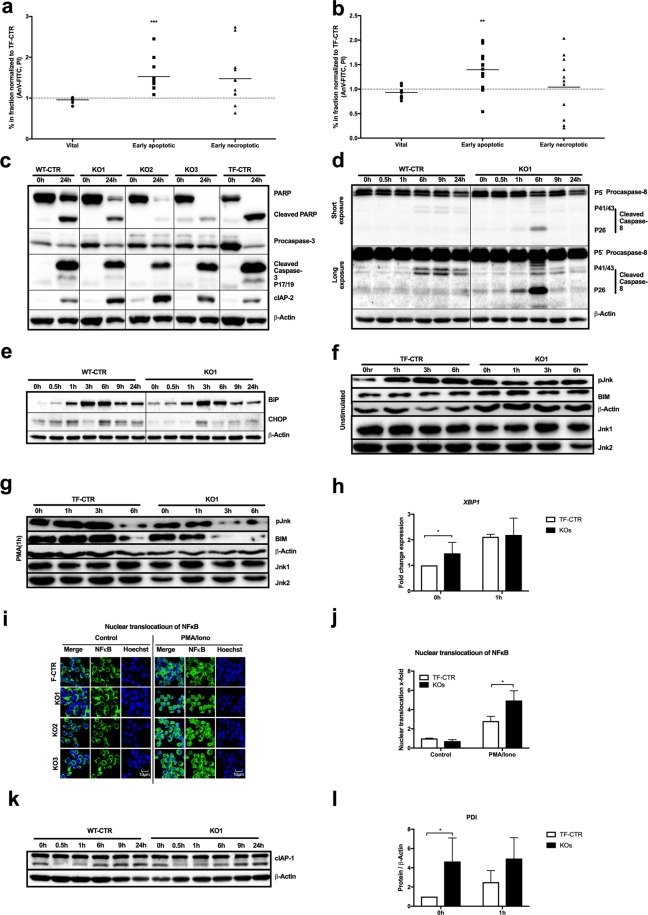
ADPGK knockout leads to apoptosis and ER stress. (a - c) Cytometric cell death analysis using propidium iodide (PI) and annexin V (AnV) staining in control and ADPGK KO cells (a) without stimulation and treated with (b) PMA/Ionomycin for 24 h. Individual ratios (dots) and median (line) are shown. N = 4 independent experiments; vital (AnV-/PI-), early apoptotic (AnV+/PI−), early necroptotic (AV−/PI+). (c) Representative immunoblot analysis of PARP-cleavage, caspase 3-cleavage and cIAP2 expression under basal conditions and after 24 h stimulation with PMA/Iono. (d) Expression and cleavage of caspase 8 and (e) expression of the ER stress marker proteins CHOP and BiP in control and KO1 cells upon different activation periods with PMA/Iono. (f,g) Immunoblotting for phospho-Jnk and Bim expression upon addition of the protein synthesis inhibitor cycloheximide (20 µg/ml) for 0, 1, 3 and 6 hours (g) without and with (h) PMA pre-stimulation (1 h). For normalization β-actin and for baseline Jnk-expression Jnk1/2 are shown. (h) RT-qPCR-analysis of spliced XBP1 with and without 1 h PMA/Iono stimulation. N = 3 independent experiments. (i,j) Nuclear translocation of NFκB upon PMA/Iono stimulation shown as (i) representative confocal single-plane micrographs stained for NfkB and nuclear counterstaining with Hoechst dye alongside (j) quantification plot. N = 3 independent experiments. (k) Immunoblots of cIAP-1 in control and KO1 cells upon different periods of stimulation with PMA/Iono. (l) Immunoblot analysis of PDI expression in control and ADPGK KO cells with and without 1 h PMA stimulation. All immunoblots are representative images of N = 3 independent experiments. If not stated otherwise, mean of CTRs (TF-CTR and WT-CTR) and KOs (KO1, KO2, KO3) are shown. In all experiments stimulation was induced as described in the text using 10 ng/mL PMA and 10 µM Ionomycin. * p < 0.05, ** p < 0.01, ***p < 0.001. All images of blots represent cropped blots of appropriate protein size. For full length blots see Supplemental Fig. 3.

Acknowledgments
This image is the copyrighted work of the attributed author or publisher, and ZFIN has permission only to display this image to its users. Additional permissions should be obtained from the applicable author or publisher of the image. Full text @ Sci. Rep.