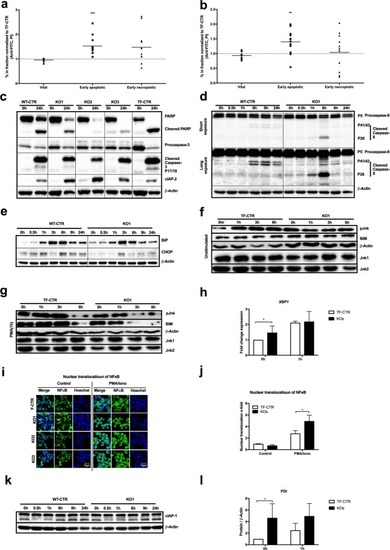
ADPGK knockout leads to apoptosis and ER stress. (a - c) Cytometric cell death analysis using propidium iodide (PI) and annexin V (AnV) staining in control and ADPGK KO cells (a) without stimulation and treated with (b) PMA/Ionomycin for 24 h. Individual ratios (dots) and median (line) are shown. N = 4 independent experiments; vital (AnV-/PI-), early apoptotic (AnV+/PI−), early necroptotic (AV−/PI+). (c) Representative immunoblot analysis of PARP-cleavage, caspase 3-cleavage and cIAP2 expression under basal conditions and after 24 h stimulation with PMA/Iono. (d) Expression and cleavage of caspase 8 and (e) expression of the ER stress marker proteins CHOP and BiP in control and KO1 cells upon different activation periods with PMA/Iono. (f,g) Immunoblotting for phospho-Jnk and Bim expression upon addition of the protein synthesis inhibitor cycloheximide (20 µg/ml) for 0, 1, 3 and 6 hours (g) without and with (h) PMA pre-stimulation (1 h). For normalization β-actin and for baseline Jnk-expression Jnk1/2 are shown. (h) RT-qPCR-analysis of spliced XBP1 with and without 1 h PMA/Iono stimulation. N = 3 independent experiments. (i,j) Nuclear translocation of NFκB upon PMA/Iono stimulation shown as (i) representative confocal single-plane micrographs stained for NfkB and nuclear counterstaining with Hoechst dye alongside (j) quantification plot. N = 3 independent experiments. (k) Immunoblots of cIAP-1 in control and KO1 cells upon different periods of stimulation with PMA/Iono. (l) Immunoblot analysis of PDI expression in control and ADPGK KO cells with and without 1 h PMA stimulation. All immunoblots are representative images of N = 3 independent experiments. If not stated otherwise, mean of CTRs (TF-CTR and WT-CTR) and KOs (KO1, KO2, KO3) are shown. In all experiments stimulation was induced as described in the text using 10 ng/mL PMA and 10 µM Ionomycin. * p < 0.05, ** p < 0.01, ***p < 0.001. All images of blots represent cropped blots of appropriate protein size. For full length blots see Supplemental Fig. 3.
|
