
- Title
-
The expression of fgfr3 in the zebrafish head
- Authors
- Ledwon, J.K., Turin, S.Y., Gosain, A.K., Topczewska, J.M.
- Source
- Full text @ Gene Expr. Patterns
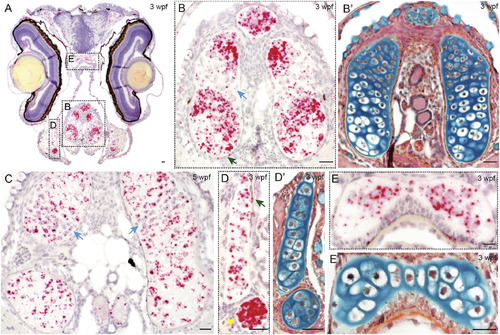
fgfr3 expression of zebrafish head at the larval stage using coronal paraffin sections. A) Specimen at 3 wpf (SL 8 mm), 5x magnification; B) Higher magnification (40x) of the ceratohyal and basihyal cartilage; B′) The same cartilage stained with pentachrome on adjacent section; C) Basihyal cartilage at 5 wpf (SL 12 mm), 40x magnification; D) Palatoquadrate cartilage at 3 wpf (SL 8 mm), and D′) pentachrome stain, 40x magnification; E) Posterior ethmoid plate at 3 wpf (SL 8 mm), and E′) pentachrome stain, 64x magnification; wpf = weeks post fertilization; green arrows indicate cells staining positive for fgfr3 in the perichondrium; blue arrows indicate proliferative zone. Scale bar = 20 μm. EXPRESSION / LABELING:
|
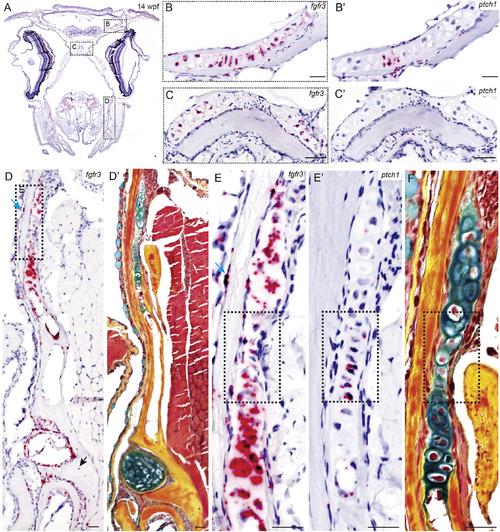
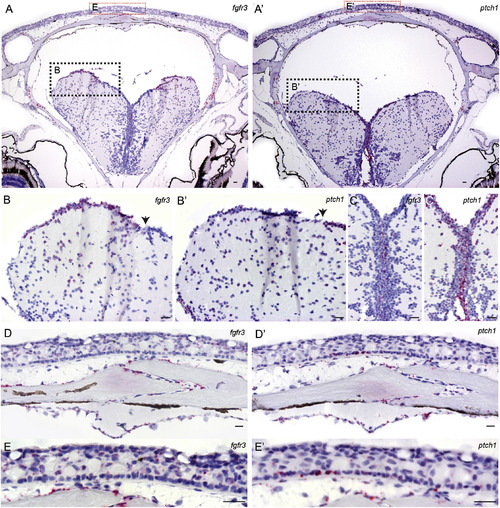
Comparative analysis of fgfr3 and ptch1 expression in the zebrafish head of young adult (14 wpf, SL 20 mm) specimen. A) General view of coronal section through head, fgfr3 probe is visualized in red, 5x magnification; B, B′) Pterosphenoid cartilage and C, C′) Posterior ethmoid plate stained for fgfr3 and ptch1, 64x magnification; D, D′) Palatoquadrate cartilage, fgfr3 and pentachrome stain, 20x magnification; E, E′, F) Digital magnification of presumed proliferative zone (dashed box), stain for fgfr3 (E), for ptch1 (E′) and pentachrome stain (F); blue arrow - osteoblasts residing in the periosteum; black arrow - osteocytes residing within the bone matrix; dashed boxes - digital magnification of presumed proliferative zone. Scale bar = 20 μm. EXPRESSION / LABELING:
|
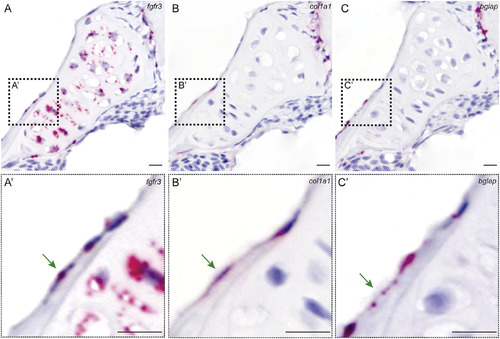
Comparative analysis of in situ hybridization for fgfr3, col1a1, and bglap. Pterosphenoid cartilage at 14 wpf (SL 20 mm) specimen, 64x magnification. A) fgfr3; B) col1a; C) bglap. Inset windows (A′, B′, C′) are digital magnifications to illustrate cells positive for the corresponding probes indicated by green arrows. Dashed boxes in upper panels are magnified and shown in the lower panels. Scale bar = 20 μm. EXPRESSION / LABELING:
|
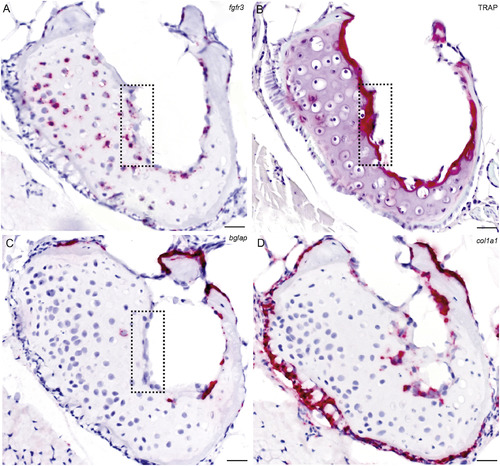
Comparative analysis of fgfr3, col1a1 and bglap expression with TRAP activity in the ceratohyal cartilage. Adjacent paraffin sections collected from adult at 14 wpf (SL 20 mm) specimen, 40x magnification. A) in situ stain for fgfr3; B) TRAP staining; C) in situ stain for bglap; D) in situ stain for col1a1. Dashed box indicates cells positive for fgfr3 and TRAP and negative for bglap. Scale bar = 20 μm. EXPRESSION / LABELING:
|
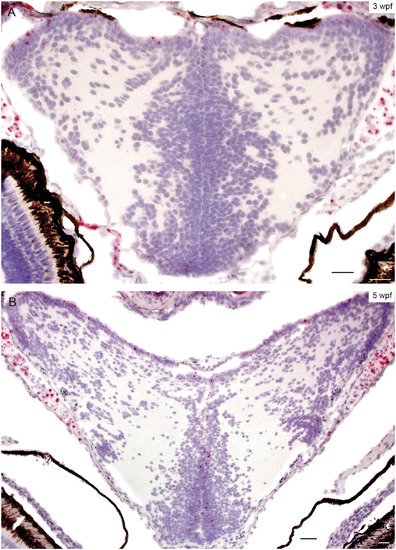
Expression pattern of fgfr3 in the juvenile zebrafish brain. Coronal sections at A) 3 wpf (SL 8 mm), B) 5 wpf (SL 12 mm) specimens, 20x magnification. Scale bar = 20 μm. EXPRESSION / LABELING:
|
Expression pattern of fgfr3 and ptch1 in the zebrafish head of adult specimen at 16 wpf (SL 25 mm). A, A′) General view, 10x magnification; B, B′) Dorsolateral and C, C′) Ventricular domain of brain, 40x magnification; D, D′) Meninges and frontal bones at the osteogenic front, 64x magnification; E, E′) Skin over the interfrontal suture, 64x magnification; black arrows indicate transition zone between expression of fgfr3 and ptch1. Scale bar = 20 μm. EXPRESSION / LABELING:
|
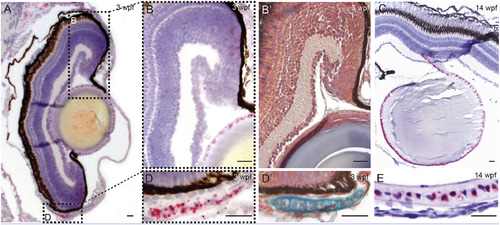
fgfr3 expression in the zebrafish eye from larval to adult stages. A) In situ stain for fgfr3 at 3 wpf (SL 8 mm), 5x magnification; B, B′) Higher magnification (64x) of dashed area in Panel A for fgfr3 and pentachrome stain; C) Lens epithelium at 14 wpf (SL 20 mm); D, D′) Infraorbital cartilage at 3 wpf (SL 8 mm) stained for fgfr3 and pentachrome, 64x magnification; E) Infraorbital cartilage at 14 wpf (SL 20 mm); Scale bar = 20 μm. EXPRESSION / LABELING:
|

Unillustrated author statements EXPRESSION / LABELING:
|
Reprinted from Gene expression patterns : GEP, 29, Ledwon, J.K., Turin, S.Y., Gosain, A.K., Topczewska, J.M., The expression of fgfr3 in the zebrafish head, 32-38, Copyright (2018) with permission from Elsevier. Full text @ Gene Expr. Patterns