
Image
|
Figure Caption
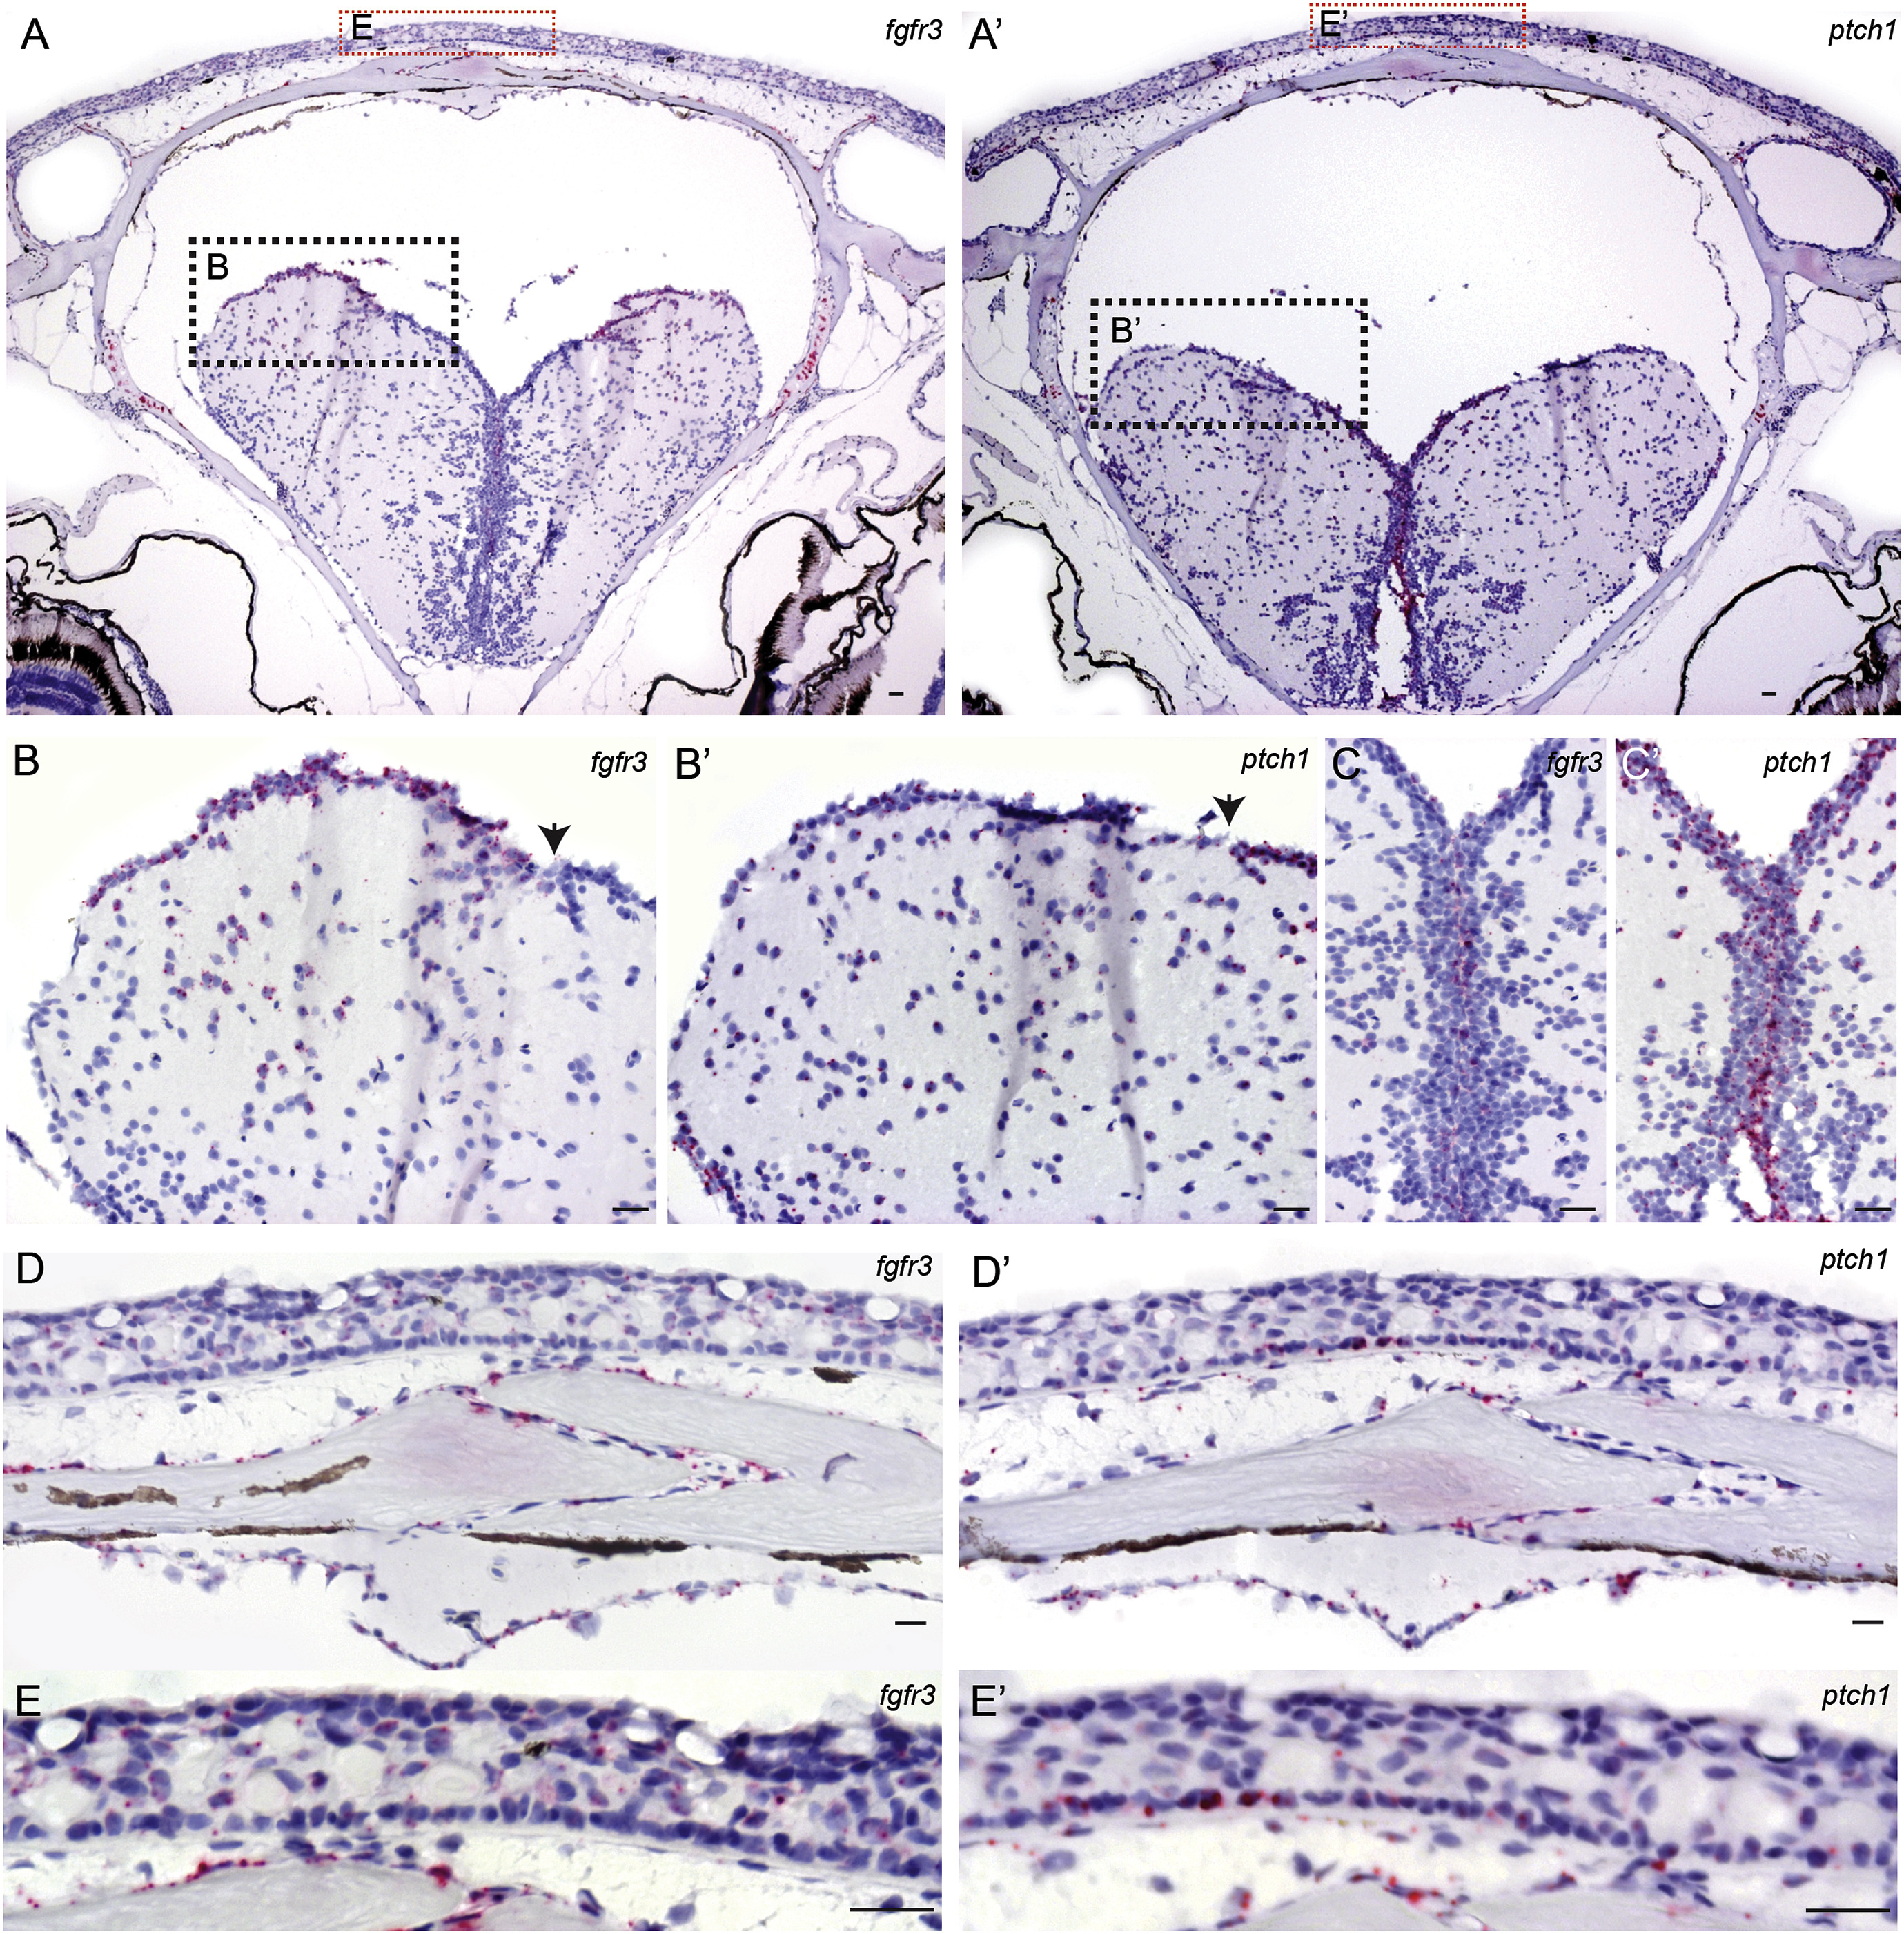
Fig. 6
Expression pattern of fgfr3 and ptch1 in the zebrafish head of adult specimen at 16 wpf (SL 25 mm). A, A′) General view, 10x magnification; B, B′) Dorsolateral and C, C′) Ventricular domain of brain, 40x magnification; D, D′) Meninges and frontal bones at the osteogenic front, 64x magnification; E, E′) Skin over the interfrontal suture, 64x magnification; black arrows indicate transition zone between expression of fgfr3 and ptch1. Scale bar = 20 μm.
Figure Data
Acknowledgments
This image is the copyrighted work of the attributed author or publisher, and
ZFIN has permission only to display this image to its users.
Additional permissions should be obtained from the applicable author or publisher of the image.
Reprinted from Gene expression patterns : GEP, 29, Ledwon, J.K., Turin, S.Y., Gosain, A.K., Topczewska, J.M., The expression of fgfr3 in the zebrafish head, 32-38, Copyright (2018) with permission from Elsevier. Full text @ Gene Expr. Patterns