
- Title
-
The Vertebrate Protein Dead End Maintains Primordial Germ Cell Fate by Inhibiting Somatic Differentiation
- Authors
- Gross-Thebing, T., Yigit, S., Pfeiffer, J., Reichman-Fried, M., Bandemer, J., Ruckert, C., Rathmer, C., Goudarzi, M., Stehling, M., Tarbashevich, K., Seggewiss, J., Raz, E.
- Source
- Full text @ Dev. Cell
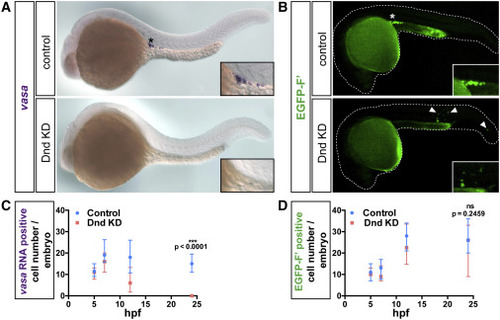
Dnd Function Is Dispensable for PGC Survival (A) The expression of vasa is lost in embryos knocked down for Dnd. Expression of vasa is visualized by in situ hybridization in 24-hpf embryos. Insets show a magnification of the position germ cells occupy in wild-type embryos (asterisk), a position devoid of PGCs in embryos knocked down for Dnd. (B) EGFP-positive cells are present in 24-hpf embryos knocked down for Dnd. PGCs are labeled with EGFP targeted to the membrane (EGFP-F′). The preferential expression of EGFP in PGCs is achieved by injection of RNA containing the 3′ UTR of nanos3 (Köprunner et al., 2001). The asterisk indicates the position of the PGCs in wild-type embryos. Arrowheads point at ectopic PGCs in Dnd-deficient embryos. Insets show magnifications of ectopic PGCs. Outlines (white dotted lines) show the contours of the embryos. (C) Graph presenting the number of PGCs detected based on vasa RNA expression during the first day of development. 58 ≤ n ≤ 75, (n, number of embryos). p Values determined using the Mann-Whitney U test with α = 0.05. Data are presented as median ± interquartile range (IQR). (D) Graph presenting the number of PGCs detected based on EGFP fluorescence during the first day of development. Whereas the number of vasa RNA-positive cells is reduced in Dnd knockdown, the number of PGCs remains similar when EGFP-positive cells are scored for. 51 ≤ n ≤ 61 (n, number of embryos). p Values determined using the Mann-Whitney U test with α = 0.05. Data are presented as median ± IQR. F′, farnesylated; KD, knockdown; hpf, hours post fertilization. See also Figure S1. |
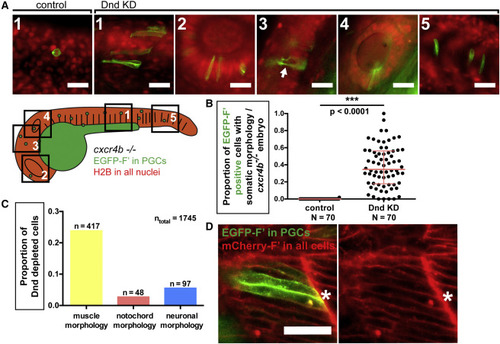
Loss of Dnd Function Results in Morphological Transdifferentiation (A) Dnd-deficient PGCs in 24-hpf cxcr4b−/− embryos exhibit different somatic morphologies based on the tissue within which they reside. A cartoon presenting a 24-hpf embryo in which distinct regions are framed and numbered. Images were captured from the following regions: 1, muscle; 2, eye; 3, brain; 4, otic capsule; 5, notochord. The preferential expression of EGFP on the membrane of PGCs is achieved by injection of RNA encoding for EGFP-F′ that contains the 3′ UTR of nanos3 (Köprunner et al., 2001). The arrow in 3 points to axon-like projections within neural tissue. Scale bars, 30 μm. (B) The proportion of PGCs showing somatic morphology in Dnd-deficient, cxcr4b−/− embryos at 24 hpf. p Values were determined using the Mann-Whitney U test with α = 0.05. Data are presented as median ± IQR. (C) Graph presenting the proportion of cells exhibiting specific somatic morphologies among all Dnd-depleted cells examined (ntotal). (D) Dnd-deficient PGCs exhibit morphology similar to that of somatic cells in their environment. Cells are labeled with farnesylated fluorescent proteins to direct the label to the membrane (F′). Confocal image captured at 24 hpf showing Dnd-deficient PGCs (asterisk) located within the developing muscle tissue (see Figure S2E for examples from other tissues). Scale bar, 50 μm. N, number of embryos; n, number of cells; F′, farnesylated; KD, knockdown; hpf, hours post fertilization. See also Figure S2. PHENOTYPE:
|
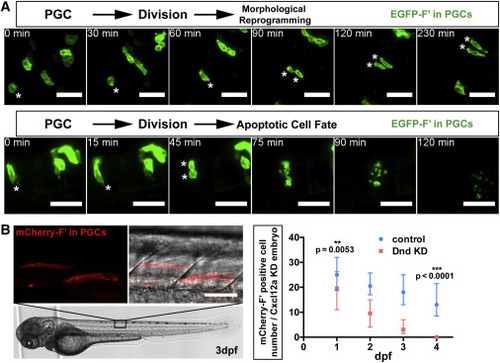
Cell Fate of Dnd-Depleted PGCs Following Cell Division and in Late Embryogenesis (A) Following division of Dnd-deficient PGCs (asterisks), both daughter cells undergo morphological reprogramming in the neural plate (upper panels, cells were imaged at 11–15 hpf) or die (lower panels, cells were imaged at 15–17 hpf). Scale bars, 50 μm. (B) PGCs (red, left) deficient for Dnd localized to the developing muscle tissue of a 3 days dpf embryo. The graph on the right shows the number of PGCs detected in control embryos and in embryos knocked down for Dnd between 1 and 4 dpf. PGCs were labeled with mCherry-F′. Scale bar, 50 μm. Directional migration was inhibited by knockdown of Cxcl12a, rendering the control cells ectopic. 21 ≤ n ≤ 38, (n, number of embryos). p Values were determined using the Mann-Whitney U test with α = 0.05. Data are presented as median ± IQR. F′, farnesylated; KD, knockdown; dpf, days post fertilization; hpf, hours post fertilization. See also Figure S3; Movies S3 and S4. |
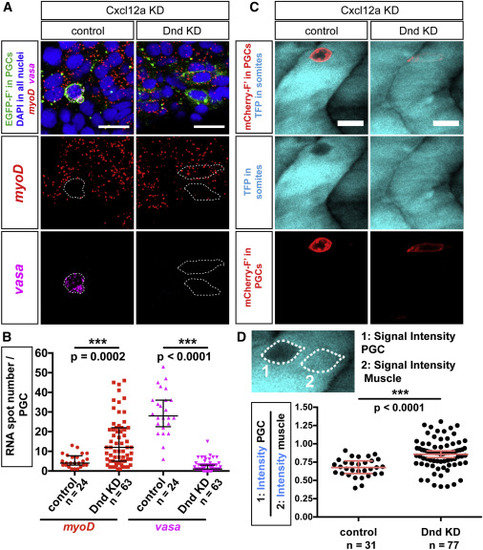
Dnd Is Required for Maintenance of Germline RNA Expression and for Inhibition of Somatic RNA Expression (A) Upregulation of the muscle-specific master regulator myoD and downregulation of the germline-specific marker vasa within Dnd-deficient PGCs, as determined by using RNAscope in situ hybridization. Confocal plane images (4.1 μm thick) were acquired at 24 hpf within myoD-expressing muscle precursors. Directional cell migration was inhibited by knockdown of Cxcl12a. Scale bars, 20 μm. (B) Graph presenting the number of vasa- and myoD-positive RNA spots detected within PGCs in control embryos and embryos knocked down for Dnd (quantification of results as presented in A). p Values determined using Mann-Whitney U test with α = 0.05. Data are presented as median ± IQR. (C) PGCs (red) captured in transgenic embryos expressing a muscle-specific transgene unc45b:tfp (blue) labeling muscle precursors in control and Dnd-deficient cells. Directional cell migration was inhibited by knockdown of Cxcl12a. Confocal plane images, 5 μm thick, captured at 24 hpf. Scale bars, 20 μm. (D) Graphs presenting signal intensity ratios of the muscle-specific transgene (as in C). Signal intensities within the PGC (1) were compared to intensities in a neighboring area of the same shape (2). p Values determined using Student’s t-test with α = 0.05. Data are presented as median ± IQR. n, number of cells; F′, farnesylated; KD, knockdown; hpf, hours post fertilization. |
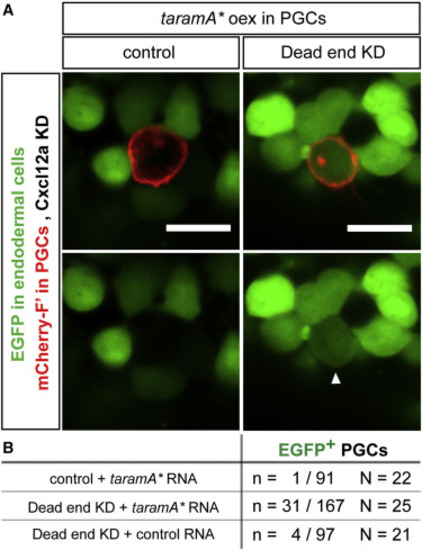
Reprogramming of PGCs to Endodermal Fate (A) Expression of EGFP under the control of the endodermal promoter sox17 in Dnd-deficient PGCs misexpressing the RNA encoding for the constitutively active form of TaramA (taramA∗). Arrowhead points at a PGC (identified by red membrane label, mCherry-F′) expressing EGFP. Directional cell migration was inhibited by knockdown of Cxcl12a. The farnesylated mCherry also labels the position of the Golgi apparatus within the PGCs. Confocal plane images (5 μm thick) were acquired at 10 hpf. Scale bars, 20 μm. (B) The number of PGCs expressing EGFP under the control of the sox17 promoter in Dnd-depleted PGCs expressing a constitutively active form of TaramA (taramA∗) at 10 hpf. N, number of embryos; n, number of cells; F′, farnesylated; KD, knockdown; hpf, hours post fertilization. |
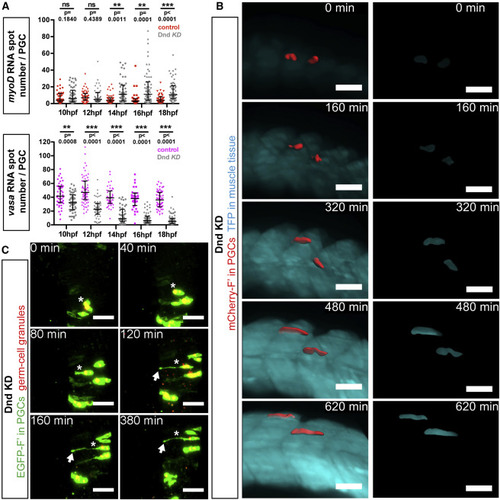
Dynamics of Germline Reprogramming in Live Zebrafish Embryos (A) Quantification of myoD-positive (top) and vasa-positive (bottom) RNA spots in 10–18 hpf cxcl12a−/− embryos. Number of RNA spots in PGCs of embryos knocked down for Dnd are represented by gray dots (upper and bottom panels), showing an increase in myoD RNA spots (red dots, upper panel) and a decrease in vasa RNA spots (pink dots, bottom panel), relative to control PGCs. p Values were determined using the Mann-Whitney U test with α = 0.05. 31 ≤ n ≤ 65 (n, number of cells). Data are presented as median ± IQR. (B) PGCs (segmented, red) located within the developing muscle tissue (blue) in live Dnd-deficient embryos knocked down for Cxcl12a (left panels). Panels on the right show expression of the muscle-specific reporter within the segmented PGCs. Light sheet microscopy images were captured between 14 and 24 hpf and are presented as 3D projections. Scale bars, 50 μm. (C) PGCs (green) located within the region of the developing neural tube in Dnd-deficient embryos knocked down for Cxcl12a. Germ cell granules were visualized using a DsRed-Granulito protein fusion. Asterisks mark a single PGC undergoing reprogramming to become a neuron-like cell. Arrows point to an axon-like protrusion. Light sheet microscopy images were acquired in 12- to 19-hpf embryos. Scale bars, 50 μm. F′, farnesylated; KD, knockdown; hpf, hours post fertilization. See also Figure S4 and Movies S5, S6, and S7. EXPRESSION / LABELING:
PHENOTYPE:
|
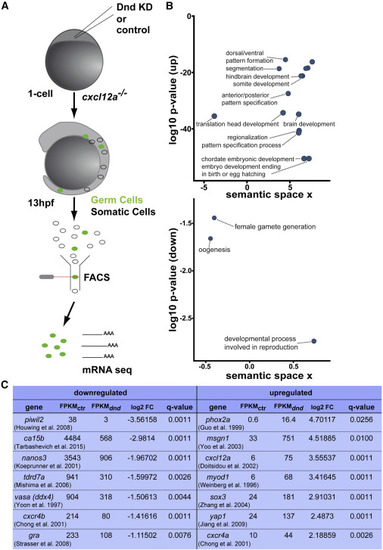
Transcriptome Analysis of Dnd-Depleted PGCs Reveals a Transformation to a Somatic Transcription Profile (A) A scheme depicting the flow of the transcriptome analysis of PGCs sorted at 13 hpf based on specific expression of EGFP (green label). (B) Upregulated transcripts (up) in PGCs knocked down for Dnd are enriched for gene ontology (GO) terms involved in somatic tissue developmental processes (upper graph). Representative terms with a minimum log10 p value of −15 are presented in this graph. Downregulated transcripts (down) showing enrichment for germline-related processes (lower graph) relative to control PGCs. Depicted are GO terms with at least 5-fold enrichment relative to control cells. (C) A table presenting selected genes from the list of up- and downregulated transcripts in Dnd-deficient PGCs relative to control cells. The list of downregulated genes includes examples of seven genes involved in germline development; the upregulated genes listed are examples of genes important for the development of different germ layers. KD, knockdown; hpf, hours post fertilization; FACS, fluorescence-activated cell sorting; mRNA seq, mRNA sequencing; FPKM, fragments per kilobase per million reads; Ctr, control; dnd, Dead end knockdown; FC, fold change. See also Table S1 (Chong et al., 2001; Doitsidou et al., 2002; Guo et al., 1999; Houwing et al., 2008; Jiang et al., 2009; Köprunner et al., 2001; Mishima et al., 2006; Strasser et al., 2008; Tarbashevich et al., 2015; Weinberg et al., 1996; Yoo et al., 2003; Yoon et al., 1997; Zhang et al., 2004). |
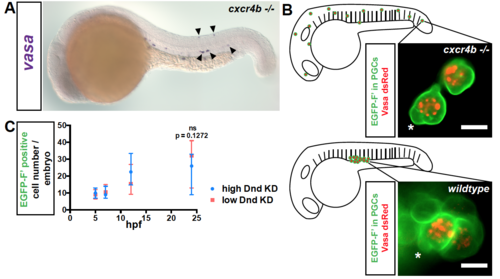
Related to Figure 1. Survival of PGCs at ectopic positions (A) Expression of vasa RNA in PGCs (blue) in cxcr4b-/- mutant embryos at 24 hpf by in situ hybridization. Arrowheads point at ectopic PGCs. (B) Characteristic bleb-like protrusions (asterisks) and germ cell granules (marked with Vasa-dsRed fusion protein, red) are observed in ectopic PGCs (membrane marked with EGFP-F’, green) in cxcr4b-/- embryos (upper panel) and in PGCs localized to the region of the gonad in wildtype embryos (lower panel). Scale bar, 10 μm. Images were captured at 19 hpf. See also movie S1. (C) A graph presenting the number of PGCs detected by expression of EGFP at different time points during the first day of development in embryos injected with either low (20 μM) or high (60 μM) amounts of dnd Morpholino. 50≤N≤61, Number of embryos (N). Data are presented as median ± IQR. Farnesylated (F’), Knockdown (KD), hours post fertilization (hpf). |
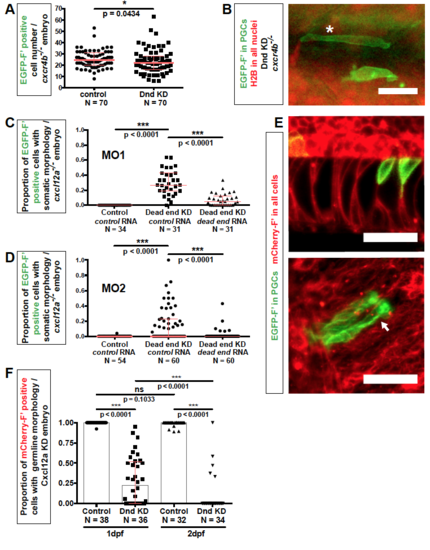
Related to Figure 2. Morphology of Dnd-depleted PGCs (A) The number of EGFP-positive cells in 24 hpf cxcr4b-/- embryos injected with either dnd or control Morpholino. p-values were determined based on Mann-Whitney-U test with α=0.05. Data are presented as median ± IQR. (B) Examples of morphological phenotypes of PGCs knocked down for Dnd (green) as observed in 24 hpf cxcr4b-/- embryos. An asterisk points at a cell defined as showing muscle cell morphology, while a neighboring cell (lower position) does not present a clear morphology of a PGC, nor of a defined somatic cell type. Scale bar, 30 μm. (C) The dnd Morpholino (MO1) specifically targets dnd RNA in zebrafish embryos. The proportion of PGCs with distinct somatic-cell morphologies in Dnd-knocked down embryos is reduced by injection of dnd RNA that is not targeted by the dnd Morpholino (MO1). The experiment was conducted in cxcl12a-/- embryos and results evaluated at 24 hpf. p-values were determined based on Mann-Whitney-U test with α=0.05 and corrected for multiple comparison. Data are presented as median ± IQR. (D) A dnd Morpholino with different binding sequence (MO2) induces a phenotype similar to that induced by MO1. The induced phenotype of MO2 can be reversed by injection of dnd RNA that is not targeted by this Morpholino. The experiment was conducted in cxcl12a-/- embryos and results evaluated at 24 hpf. p-values were determined based on Mann-Whitney-U test with α=0.05 and corrected for multiple comparison. Data are presented as median ± IQR. (E) Dnd-deficient PGCs (green) exhibit morphologies similar to those of notochord (left) and neuronal cells (right). The arrow points at dendrite-like protrusions as observed employing maximum intensity projection. Somatic cells (red) were labeled with mCherry-F’. Confocal images captured at 24 hpf. Scale bars, 50 μm. (F) Proportion of PGCs showing germline morphology in Dnd-depleted, Cxcl12a knockdown embryos at 1 and 2 days post fertilization (dpf). Number of embryos (N). p-values were determined using the Mann-Whitney-U test with α=0.05 and corrected for multiple comparison. Data are presented as median ± IQR. Number of embryos (N), Farnesylated (F’), Knockdown (KD), hours post fertilization (hpf), days post fertilization (dpf), Morpholino (MO). |
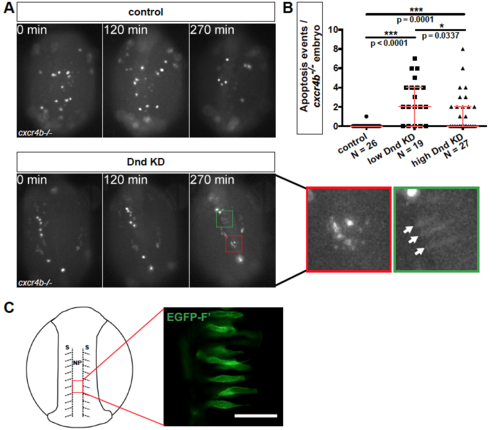
Related to Figure 3. Apoptosis of Dnd-depleted PGCs (A) Germ cell death in time-lapse movies captured by light microscopy between 12 and 16 hpf in control and in embryos knocked down for Dnd. In both cases, directional cell migration was inhibited by knockout of the cxcr4b gene. The asterisk marks PGCs undergoing apoptosis (red boxes). In Dnd-deficient embryos the PGCs are immotile and some are undergoing morphological transdifferentiation (green boxes, arrows point at cells). Embryos are oriented with anterior up. See also movie S2. (B) The number of PGC apoptosis events in 12 to 16 hpf cxcr4b-/- embryos injected either with low (20 μM) or high (60 μM) amounts of dnd Morpholino. p-values were determined using the Mann-Whitney-U test with α=0.05 and corrected for multiple comparison. Data are presented as median ± IQR. (C) Mosaic labeling of somatic cells (green) in the neural plate (red box) in 14 hpf wildtype zebrafish embryos. 20 μm thick confocal plane image of somatic cells labeled with EGFP-ras. Scheme shows the embryo from dorsal view with the location of the imaged cells marked. Scale bar, 50 μm. Number of embryos (N), Farnesylated (F’), Knockdown (KD), hours post fertilization (hpf), Neural Plate (NP), Somites (S). |

Related to Figure 6. Germ cell granules in Dnd-deficient PGCs. (A) The number of germ cell granules per cell in Dnd-depleted and Cxcl12a knockdown embryos at 24 hpf (left). Maximum-intensity projection images of PGCs (Farnesylated EGFP, green) at 24 hpf showing germ cell granules (Granulito-dsRed, red) (right). Number of cells (n). Scale bars, 10 μm. p-values were determined using the Mann-Whitney-U test with α=0.05. Data are presented as median ± IQR. (B) Proportion of PGCs containing germ cell granules in Cxcl12a knockdown embryos upon depletion of Dnd between 1 and 3 dpf as compared to control treated PGCs. Number of embryos (18≤N≤38). Embryos lacking PGCs were omitted from the analysis. p-values were determined using the Mann-Whitney-U test with α=0.05. Data are presented as median ± IQR. (C) Localization of the germ granule components Vasa and Nanos (green) in PGCs knocked down for Dnd (red membrane). EGFP fusion proteins of Vasa and Nanos translated from injected mRNAs that contained 3’UTR of the corresponding genes. 10 μm thick confocal plane images captured at 10 and 24 hpf. Scale bars, 10 μm. Farnesylated (F’), Knockdown (KD), hours post fertilization (hpf), days post fertilization (dpf). |
Reprinted from Developmental Cell, 43, Gross-Thebing, T., Yigit, S., Pfeiffer, J., Reichman-Fried, M., Bandemer, J., Ruckert, C., Rathmer, C., Goudarzi, M., Stehling, M., Tarbashevich, K., Seggewiss, J., Raz, E., The Vertebrate Protein Dead End Maintains Primordial Germ Cell Fate by Inhibiting Somatic Differentiation, 704-715.e5, Copyright (2017) with permission from Elsevier. Full text @ Dev. Cell