
- Title
-
Microtubule-actin crosslinking factor 1 (Macf1) domain function in Balbiani body dissociation and nuclear positioning
- Authors
- Escobar-Aguirre, M., Zhang, H., Jamieson-Lucy, A., Mullins, M.C.
- Source
- Full text @ PLoS Genet.

Macf1a is essential in relocalizing Buc from the Bb to the oocyte cortex. A) macf1a ovary cDNA from zebrafish was sequenced to determine the Macf1a domains that are expressed. CH = calponin-homology domain (yellow); PRD = Plectin repeat domain (pink); EF = Ca+2 binding domain (brown); Gas2: MT binding domain (red); IF = Intermediate filament. The exons are numbered and color-coded according to the domains. The premature stop codon locations in mutant alleles, macf1asa12708 and macf1ap6cv, are shown. B) DiOC6 staining (mitochondria, green) and dazl in situ (green) in early and late stage I oocytes, labeling in WT the Bb prior to disassembly (early stage I) and the disassembled Bb at the cortex (late stage I). macf1ap6cv and macf1asa12708 mutant oocytes display a normal Bb in early stage I, but in late stage I the Bb enlarges and never disassembles. In addition, macf1a mutants show an acentric nuclear position compared to WT. DiOC6: N≥5 ovaries, >30 WT, macf1ap6cv, and macf1asa12708 oocytes. dazl in situ: N = 5 ovaries, >30 WT, 25 macf1ap6cv and 35 macf1asa12708 oocytes. C-D) Buc staining (green) to visualize Bb disassembly in stage I oocytes in WT and macf1a mutants (C-D, images correspond to different oocytes). E) Quantification method for Bb disassembly during stage I. The two images (E-E’) correspond to a Z-stack from C” where green represents the areas of Buc Bb and Buc total of oocytes that were segmented according to Buc signal intensity (see methods). The yellow circle marks the oocyte perimeter, which was used to estimate the oocyte diameter. F) Bb disassembly versus oocyte size (60 μm diameter early stage I to 160 μm late stage I) in WT, macf1ap6cv and macf1asa12708 mutants. Buc Bb/Total Buc (a quantitative measure of Bb disassembly) decreases as oocyte diameter (μm) increases, and this correlation between X and Y values is significant in WT (R2 = 0.732, correlation coefficient. **** P value < 0.0001), but not in macf1ap6cv (R2 = 0.03, P value = 0.2377) and macf1asa12708 (R2 = 0.17, P value = 0.1764). N≥ 3 ovaries, WT and mutant oocytes. DAPI staining labels DNA (blue or magenta) and marks follicle cells. Images are single optical sections, except for E-E’. Arrowheads indicate Bb and N the nucleus. Scale bar: 20 μm. All images are representative from at least 3 experiments. |

Epistasis of bucky ball and macf1a in nuclear positioning. A-D) DiOC6 staining (mitochondria, green) and dazl in situ (E-H, red) in stage I oocytes label the Bb. (A, E) WT with centered nucleus and Bb present. (B, F) buc mutant with centered nucleus, absent Bb, and unlocalized dazl. (C, G) macf1a mutant with acentric nucleus and Bb enlarged. (D, H) macf1ap6cv; buc double mutant with acentric nucleus, absent Bb, and unlocalized dazl. DAPI (blue) stains DNA (A-D). DiOC6: N≥ 3 ovaries; >30 WT, >30 macf1ap6cv, 15 bucp106re, 24 macf1ap6cv; bucp106re oocytes. dazl in situ: N = 3 ovaries; 10 bucp106re, 7 macf1ap6cv, 14 macf1ap6cv; bucp106re oocytes. Representative images from 2 experiments. Dotted white lines outline the nucleus. Images are a sum of 3 single optical confocal sections. Arrowheads indicate the Bb. Scale bar: 20 μm. |
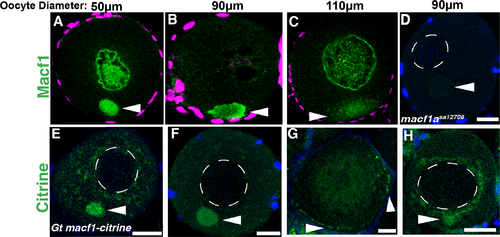
Localization of Macf1a in stage I oocytes. A-C) Macf1a immunostaining (green) in stage I oocytes shows localization nuclearly and within the Bb (A), and later at the cortex during Bb disassembly (B, C). D) Macf1a staining was negative in a macf1asa12708 mutant oocyte. E-G) GFP staining in Gt(macf1a–citrine)ct68a line also showed Macf1a-Citrine localization to the Bb and at the cortex during disassembly. DAPI (blue/magenta) stains DNA. A-D) N≥ 3 ovaries, 20 isolated WT oocytes were examined (see methods), 16 oocytes showed Macf1 nuclear staining; 18 macf1asa12708 oocytes were examined. E-H) N = 3 ovaries, 9 of 20 Gt(macf1a–citrine)ct68a/+ oocytes showed nuclear staining (H). Representative images from 3 experiments. Dotted white lines outline the nucleus. Images are a sum of 3 single optical confocal sections. Arrowheads indicate the Bb. Scale bars: 20 μm. |
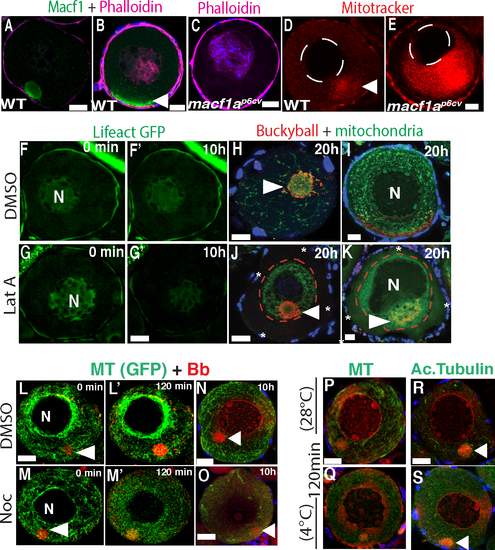
Effect of disrupting actin and MTs on the Bb and nuclear positioning. A-B) Macf1 (green) and phalloidin staining in WT, and C) phalloidin in macf1ap6cv mutant oocytes labeling cortical and intranuclear actin. N = 3 ovaries, 5 WT and 10 macf1ap6cv mutant oocytes. WT (D’) and macf1ap6cv mutant (E) live stage I oocytes stained with MitoTracker to visualize the cortical detachment of mitochondria in macf1a mutant. N = 3 ovaries, 22 WT and 7 macf1ap6cv oocytes. F-G) Live imaging of Lifeact-GFP ovaries treated with DMSO (F-F’) or LatA (G-G’) for 10h. G’) GFP signal decreases indicating acting disruption. H-K) Dissected ovaries enriched for stage 1 and 2 oocytes were treated with DMSO (H-I) or LatA (J-K) for 20 h, then fixed and stained for mitochondria (DiOC6, green) and Buc (red). Asterisks and red dotted line mark the cortical detachment of mitochondria and Buc in LatA treated oocytes (J-K). The number of oocytes imaged that showed the mitochondrial cortical detachment in DMSO and LatA treated was 3/25 and 25/40, respectively. F) The oocytes that displayed an acentric nucleus after LatA treatment was 15 of 40 oocytes. N ≥ 5 ovaries. L-M) live imaging of stage I oocytes Tg(ef1a:dclk-GFP) to visualize MTs (green) and Mitotracker (mitochondria, red) to visualize the Bb. Oocytes were treated with DMSO (L, control) or nocodazole (M). N≥5 ovaries, 75 DMSO and 73 nocodazole treated oocytes. N-O) Ovaries from Tg (EMTB-3GFP) treated with DMSO (N) or nocodazole (O) for 10h, and stained for MTs (GFP) and mitochondria (DiOC₆). N = 3 ovaries, 10 oocytes DMSO treated and 11 nocodazole treated. P-S) Ovaries incubated at 28°C (P,R) or 4°C (Q,S) to depolymerize stable MTs, were fixed after 120 min cold treatment and stained for MTs (P, Q; Tg(ef1a:dclk-GFP)) or acetylated tubulin (R, S). N≥5 ovaries, 53 (28°C) and 50 (4°C) oocytes. Arrowheads indicate the Bb. Scale bar: 20 μm. |
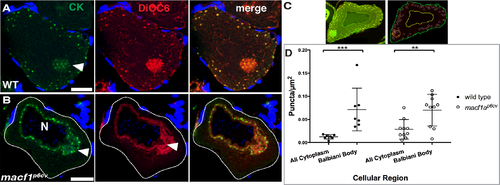
Distribution of cytokeratin in stage I oocytes. A-B) Cytokeratin (CK, green) immunostaining and DiOC6 labeling (Bb, red) in ovary tissue sections. A) In WT, CK puncta are distributed within the Bb (arrowhead) and cortically, whereas in macf1ap6cv mutant oocyte (B-C) CKs are devoid from the cortex (white outline) and are around the nucleus. C-D) Quantification of CK enrichment in the Bb. C) DiOC6 staining pattern was used to segment the oocyte into regions of interest (ROI). Outlines show identified plasma membrane (green), nucleus (yellow) and Bb (orange). All cytoplasm defined by the area between yellow and green lines. White circles around identified CK puncta. CK puncta density was measured in each region of interest (ROI). Images are representative of 3 experiments. DAPI (blue) stains the follicle cell nuclei (A-B). Images are single optical sections. Scale bar: 20 μm. N ≥ 5 ovaries, > 30 WT and > 20 macf1ap6cv oocytes. D) Graph of CK enrichment (CK puncta/μm2) in ROIs. N = 2 ovaries, 7 wild type and 10 macf1ap6cv.oocytes were used for quantification. Error bars, standard error of the mean. Black bar shows the mean. P values are calculated for ROI differences by two-way ANOVA and Tukey's Multiple Comparison Text to compare between genotypes. ** P < 0.01; *** P < 0.001. |

Characterization of macf1ap1CH1, macf1ap2CH1CH2 and macf1ap3PRD mutants. DiOC6 (mitochondria, green) and Buc (red) staining in early and late stage I oocytes. macf1ap1CH1 /macf1asa12708 and macf1ap2CH1CH2 /macf1sa12708 ovaries display a macf1a null phenotype, whereas macf1ap3PRD / macf1sa12708 show no phenotype. macf1ap1CH1 ovaries showed incomplete penetrance, displaying either a WT or a macf1a null phenotype. macf1ap2CH1CH2 oocytes displayed a macf1a null phenotype, and macf1ap3PRD showed no phenotype. DiOC6 and Buc; N≥ 3 ovaries of each genotype, 31 macf1ap1CH1, 25 macf1ap1CH1/macf1asa12708, 11 macf1ap2CH1CH2/ macf1asa12708, 22 macf1ap2CH1CH2, 15 macf1ap3PRD/macf1sa12708 and 24 macf1ap3PRD oocytes. DAPI (blue) stains the DNA. Dotted white lines outline the nucleus. Images are single optical sections. Arrowheads in indicate the Bb, and in B the egg cytoplasm. Scale bar: 20 μm. |

Macf1 localization and expression in macf1ap1CH1 and macf1ap2CH1CH2 mutants. A-C) Macf1a immunostaining (red) in WT and macf1ap1CH1/macf1asa12708 and macf1ap2CH1CH2. N≥ 3 ovaries, 20 oocytes macf1ap1CH1/macf1asa12708 and 28 oocytes macf1ap2CH1CH2. D) AV polarity in WT and lack of polarity in macf1asa12708, macf1ap1CH1/macf1asa12708 and macf1ap2CH1CH2/macf1sa12708 mutant eggs, where the cytoplasm (arrowheads) surrounds the yolk instead of forming the blastodisc. Mutant macf1ap1CH1 females produced an incompletely penetrant egg phenotype. Late blastula embryos from macf1ap3PRD/ macf1sa12708 and macf1ap3PRD mutant females displayed normal AV polarity and development. Arrowheads in D indicate the egg cytoplasm. Scale bar: (A-C) 20 μm and (D) 100 μm. |
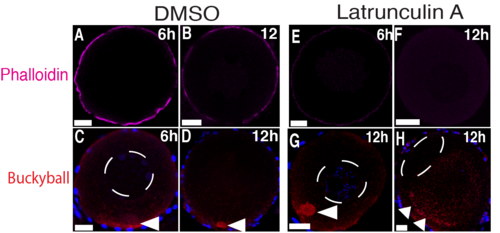
Latrunculin A treatment of stage I oocytes. Ovaries treated with DMSO (A-D) or LatA (E-H) for 6h or 12h, then fixed and stained with phalloidin (magenta) (A, B, E and F) or Buc (red) (C, D, G and H). Arrowheads point to Buc localized to the Bb and the cortex. After 6h of treatment, no effect was found on the Bb or nucleus in 18 DMSO or 22 LatA treated oocytes. After 12h of treatment, 19 DMSO-treated oocytes were normal, whereas 4/22 LatA-treated oocytes showed Buc cortical detachment, three of which showed an acentric nucleus. N ≥ 5 ovaries. Scale bar: 20 μm. |