
Fig. 5
- ID
- ZDB-FIG-180131-16
- Publication
- Escobar-Aguirre et al., 2017 - Microtubule-actin crosslinking factor 1 (Macf1) domain function in Balbiani body dissociation and nuclear positioning
- Other Figures
- All Figure Page
- Back to All Figure Page
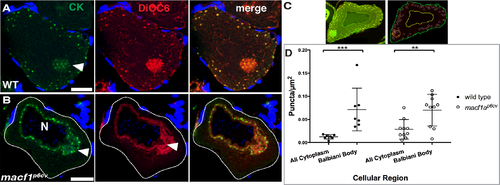
Distribution of cytokeratin in stage I oocytes. A-B) Cytokeratin (CK, green) immunostaining and DiOC6 labeling (Bb, red) in ovary tissue sections. A) In WT, CK puncta are distributed within the Bb (arrowhead) and cortically, whereas in macf1ap6cv mutant oocyte (B-C) CKs are devoid from the cortex (white outline) and are around the nucleus. C-D) Quantification of CK enrichment in the Bb. C) DiOC6 staining pattern was used to segment the oocyte into regions of interest (ROI). Outlines show identified plasma membrane (green), nucleus (yellow) and Bb (orange). All cytoplasm defined by the area between yellow and green lines. White circles around identified CK puncta. CK puncta density was measured in each region of interest (ROI). Images are representative of 3 experiments. DAPI (blue) stains the follicle cell nuclei (A-B). Images are single optical sections. Scale bar: 20 μm. N ≥ 5 ovaries, > 30 WT and > 20 macf1ap6cv oocytes. D) Graph of CK enrichment (CK puncta/μm2) in ROIs. N = 2 ovaries, 7 wild type and 10 macf1ap6cv.oocytes were used for quantification. Error bars, standard error of the mean. Black bar shows the mean. P values are calculated for ROI differences by two-way ANOVA and Tukey's Multiple Comparison Text to compare between genotypes. ** P < 0.01; *** P < 0.001. |