
- Title
-
Specific and Efficient Uptake of Surfactant-Free Poly(Lactic Acid) Nanovaccine Vehicles by Mucosal Dendritic Cells in Adult Zebrafish after Bath Immersion
- Authors
- Rességuier, J., Delaune, E., Coolen, A.L., Levraud, J.P., Boudinot, P., Le Guellec, D., Verrier, B.
- Source
- Full text @ Front Immunol
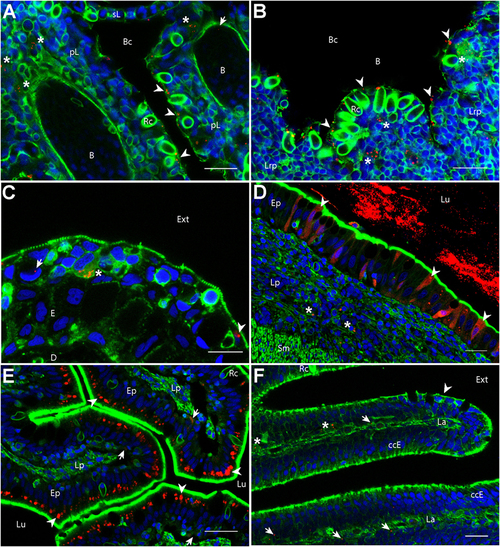
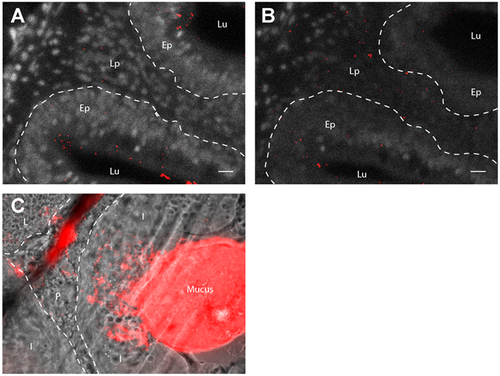
Biodistribution of poly(lactic acid) nanoparticles (PLA-NPs) in mucosae and thymus. Representative confocal images of gills (A), thymus (B), skin (C), intestines (D,E), and the olfactory mucosa (F), of wild-type adults immersed for 24 h in 0.01% red fluorescent nanoparticles (NPs). Images were acquired in 40-μm-thick whole-body cryosections, stained with phalloidin (green) and DAPI (blue). (A) In gills, NPs are found in pavement cells lining the branchial cavity (arrowheads), accumulated in cells located in the sub-epithelial compartment (stars), and detected in the blood (arrow). (B) NPs are located in pavement cells lining the branchial cavity above the thymus (arrowheads) and accumulated in cells of the lympho-reticular parenchyma in the thymus (stars). (C) In skin, NPs are visible in keratinocytes (arrowhead), goblet cells (characterized by kidney-shaped nucleus, arrow) and accumulated in intra-epithelial cells (star). (D,E) In the intestine, a high number of NPs is found inside the intestinal lumen (D). As illustrated in the end-gut (D), NPs are taken up by enterocytes (arrowheads), which display a diffuse signal. A number of NPs is also observed in sub-epithelial cells (stars). In the post-midgut (E), NPs are mainly found in apical areas of specialized enterocytes (arrowheads); a subset is also found at the basal epithelial side (arrows). (F) In the nasal mucosa, NP-positive cells are found in the olfactory epithelium (arrowhead) and the lamina (arrows). NPs are accumulated in large cells of the lamina (stars). B, blood vessels; pL, primary lamellae; sL, secondary lamellae; Bc, branchial cavity; Rc, rodlet cells; E, epidermis; D, dermis; Ext, external environment; Lu, Lumen; Ep, epithelium; Lp, lamina propria; Sm, smooth muscles; Lrp, lympho-reticular parenchyma; La, lamina. Scale bar: 10 μm (B,E), 20 μm (A,C,F), and 30 μm (D). |
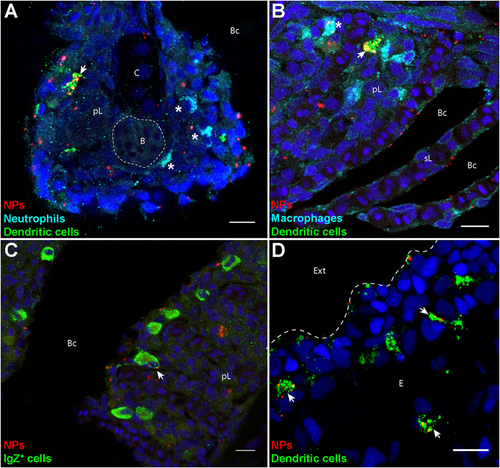
Poly(lactic acid) nanoparticles (PLA-NPs) are accumulated in mucosal antigen-presenting cells. (A–D) Representative confocal images of gills (A–C) and skin (D) of wild-type adults immersed for 24 h in 0.01% fluorescent PLA-NPs (red). Images were acquired from 40-μm-thick whole-body cryosections, stained for neutrophils (Mpx-positive, cyan) (A), macrophages (Mpeg1-positive, cyan) (B), IgZ+ B-cells (green) (C), and dendritic cells (DCs) (PNA, green) (A,B,D), in addition to nuclei (DAPI, blue). Maximal intensity projections from 3 (A–C) or 5 (D) optic sections acquired every micrometer. Nanoparticle (NP) accumulations are observed in gill DCs [(A,B), arrows], macrophages [(B), star], and IgZ+ cells [(C), arrow], while no NP are detected in neutrophils [(A), stars]. NPs are also taken up by a network of skin DCs [(D), arrows]. pL, primary lamellae; sL, secondary lamellae; Bc, branchial cavity; B, blood; C, cartilage; Ext, external environment; E, epidermis. Scale bar: 10 μm. |
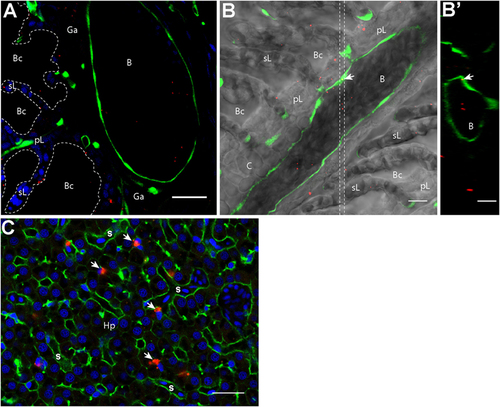
Nanoparticles (NPs) reach the circulatory system and the liver. (A,B′) Representative confocal images of gills from transgenic fli:GFP adults bathed for 24 h in 0.05% red fluorescent NPs. Images were acquired in 40-μm-thick whole-body cryosections, stained with DAPI [blue in (A)]. NPs are found in the lumen of gill arch (A) and gill filament (B) blood vessels, which are delimited by green endothelial cells. NPs were also detected inside endothelial cells [arrow in (B)]. (B′) These observations are confirmed by the orthogonal view realized in the area between the two dotted lines in (B). (C) Representative confocal image of the liver of wild-type adults exposed to 0.01% red fluorescent NPs. Images were acquired in 40-μm-thick whole-body cryosections, stained with phalloidin (green) and DAPI (blue). NPs are highly concentrated in cells close to sinusoids (s) and displaying an oblong nucleus (arrows). pL, primary lamellae; sL, secondary lamellae; Bc, branchial cavity; B, blood vessel; Ga, gill arch; C, cartilage; Hp, hepatocytes. Scale bar: 10 μm (B,B′), 20 μm (A,C). |
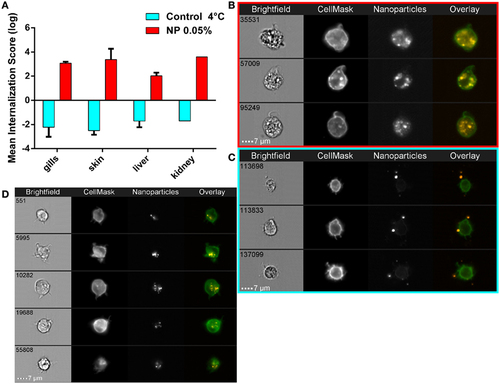
Active nanoparticles (NPs) internalization in cells of mucosae, kidneys, and liver. (A) NP internalization score, assessed by imaging in flow, in dissected organs from adult zebrafish exposed to 0.05% red fluorescent NPs (red histograms). As a negative control for internalization (blue histograms), PLA-NPs were added at 4°C just before acquisition on the cell suspension from fish unexposed to NP. Whereas most NPs are found at or outside the cell membrane in the negative controls (internalization scores <−1), a high majority of NPs is detected inside the cells of NP-treated fish (internalization scores >2) in all analyzed organs. (B–D) Representative images of NPs in kidney (B,C) or gill (D) cell suspensions, from NP-exposed fish (B,D) or control conditions (C), which display membrane processes reminiscent of dendrites. Total number of analyzed cells (NP 0.05%/4°C control): gills (three independent acquisitions) 1312/4355, skin (two independent acquisitions) 345/4185, liver (two independent acquisitions) 1431/2651, and kidney (one acquisition) 117/3180. One fish per acquisition. Error bars: SD. |
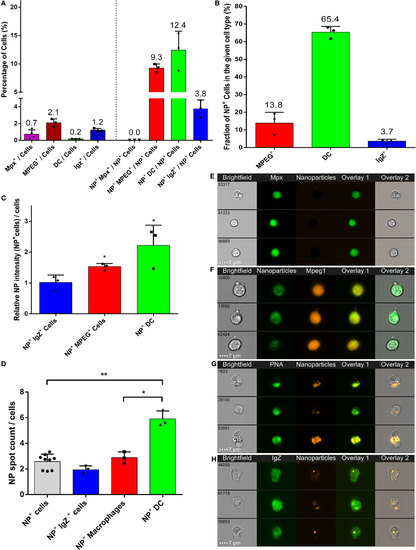
High uptake of poly(lactic acid) nanoparticles (PLA-NPs) by mucosal dendritic cells (DCs). (A–D) Quantification by imaging flow cytometry of the nanoparticle (NP) uptake by gill phagocytes from adult zebrafish, previously immersed for 24 h in 0.05% NPs. For each cell type, results from at least three independent acquisitions are represented as dots; histograms indicate the mean. Neutrophils and macrophages were labeled by GFP and mCherry expression in transgenic mpx:GFP and mpeg1:mCherry fish, respectively (one fish per acquisition). DCs and IgZ+ B-cells were identified based on high intracellular and granular FITC-PNA staining and intracellular IgZ staining, respectively (two fishes per acquisition). (A) Percentage of NP-positive cells, for each phagocyte type, relative to the total number of cells (left) or of NP-positive cells (right). APCs, which represent less than 4% of total cells in gills, represent over 25% of NP-positive cells altogether, among which DCs show the most important enrichment. (B) Percentage of NP-positive cells within each cell type. A high majority of DCs are positive to PLA-NPs. (C) NP signal intensity per cell relative to the mean fluorescence of all NP-positive cells. DCs and macrophages internalize more NPs than average. (D) NP signal spot count per cell. DCs display more signal foci than average. (E–H) Representative images of neutrophils (E), NP-positive macrophages (F), DCs (G), and IgZ+ cells (H). Error bars: SD. Significance level is indicated as: *p < 0.05, **p < 0.01. |
Artefactual nanoparticle displacement at cryosection surface. (A, B): Images of 40µm-thick gut cryosections from adult zebrafish exposed for 24h to 0.05% red fluorescent nanoparticles. Pictures are maximal intensity projection of 5 confocal pictures taken every two micrometers. Whereas acquisitions in the core of the cryosection reveal low nanoparticle uptake in the lamina propria (A), a larger number of nanoparticles are detected in the same region at the surface the cryosection (B), suggesting that PLA nanoparticles may be displaced during immersion steps of the staining protocol. (C): Epifluorescence image from similar cryosections, cut across a nanoparticle-rich region of the gut lumen. The smear of nanoparticles originating from the lumen suggests that the cryosecting blade may displace nanoparticles at the surface of sections. Lu (Lumen), Lp (Lamina propria), Ep (Epithelium), I (Intestines), P (Pancreas), L (Liver). Scale bar: 10 µm |
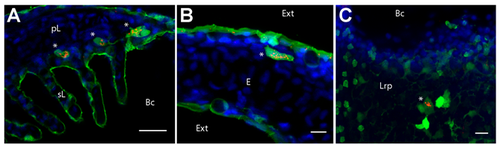
Cells with high intracellular and granular PNA staining express MHC2. Confocal images of gill (A), skin (B) and thymus (C) cryosections from mhc2dab:GFP adult fish, following PNA (red) and DAPI (blue) staining. Single optical section (A) or maximal intensity projections from 9 (B) or 5 (C) optical sections taken every micrometer. pL (primary Lamellae), sL (secondary Lamellae), Bc (Branchial cavity), Ext (External environment), E (Epidermis), Lrp (Lympho-reticular parenchyma). Scale bar: 10 µm (B, C), 20 µm (A). |