
- Title
-
High-resolution 3D imaging of whole organ after clearing: taking a new look at the zebrafish testis
- Authors
- Frétaud, M., Rivière, L., Job, É., Gay, S., Lareyre, J.J., Joly, J.S., Affaticati, P., Thermes, V.
- Source
- Full text @ Sci. Rep.
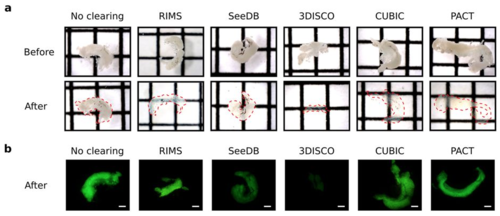
Testes were dissected from the zebrafish transgenic line Tg(gsdf:GFP) and cleared with RIMS, SeeDB, 3DISCO, CUBIC or PACT protocols. Testes were incubated in the refractive index matching solution of the last step of each protocol and imaged within 1 day. (a) Brightfield images of testes before and after clearing with the indicated methods. Transparency is assessed by the visualization of black lines situated underneath each sample. Dotted red line indicates the edge of testes after clearing. Square = 1.6 mm × 1.6 mm. (b) GFP fluorescence of cleared and non-cleared testes. The different clearing protocols used are indicated. Scale bar: 500 μm. |
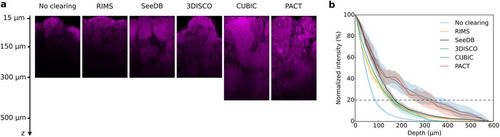
Two-photon imaging of testes cleared with RIMS, SeeDB, 3DISCO, CUBIC or PACT protocols. (a) XZ planes of testes. Nuclei were stained with propidium iodide (in magenta). Laser intensity was set in order to be next to saturation at the beginning of the stack and no depth compensation was used. No brightness and contrast enhancement was applied. (b) Quantification of fluorescence intensity. Mean fluorescence intensity was normalized and plotted against the imaging depth. Mean ± SEM of 4–12 ROI acquired on 2–3 different testes. |
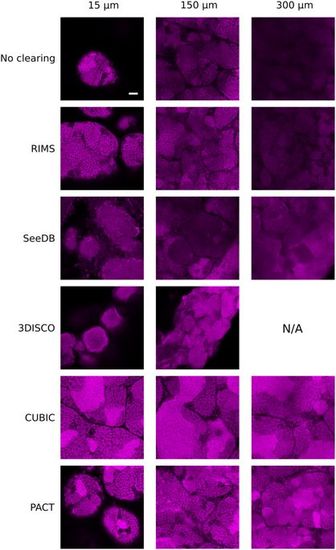
Two-photon imaging of testes cleared with RIMS, SeeDB, 3DISCO, CUBIC or PACT protocols. XY planes of testes at three different imaging depths: 15 μm, 150 μm and 300 μm. Nuclei were stained with propidium iodide (in magenta). Laser intensity was set in order to be next to saturation at the beginning of the stack and no depth compensation was used. Brightness and contrast has been modified to assess spatial resolution. Images were acquired at a scanning speed of 400 Hz and at a resolution of 1024 × 1024 pixels with two lines average. N/A: Not available because there is no tissue at this depth. Scale bar: 50 μm. |
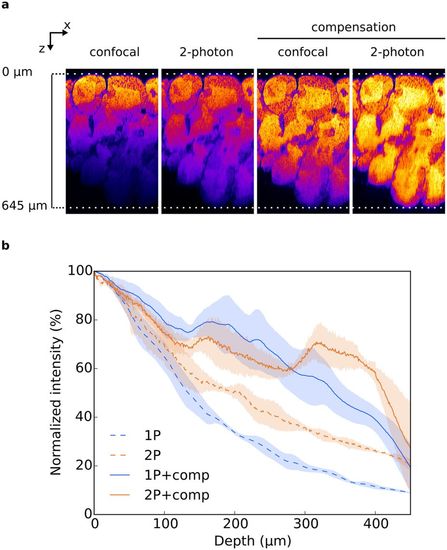
(a) XZ planes of testis treated with CUBIC and acquired either by confocal or 2-photon microscopy, with or without laser compensation. No brightness and contrast enhancement was applied. Nuclei were stained with propidium iodide and pseudocolored. (b) Fluorescence intensity quantification. Mean fluorescence intensity was normalized and plotted against the imaging depth. All data are mean ± SEM of 3 ROI acquired on 1 testis. |
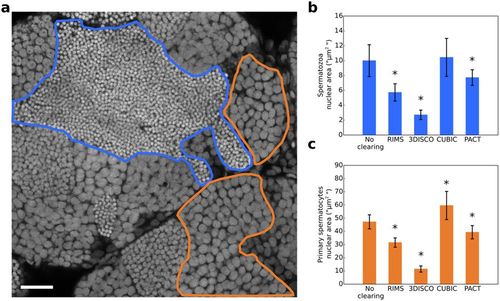
(a) Optical section of a non-cleared testis. Nuclei were stained with propidium iodide. Nuclei of germ cells at different stages of differentiation are packed in distinct domains. A spermatozoa domain is delineated in blue and a primary spermatocyte domain is delineated in orange. For each clearing condition (RIMS, 3DISCO, CUBIC and PACT), the nuclear area of 55 spermatozoa and 55 primary spermatocytes was measured, spreading across 11 optical sections from two testes. (b) Nuclear area of spermatozoa. (c) Nuclear area of primary spermatocytes. All data are indicated as mean ± SD. *Indicates a significant difference as compared with PBS (p < 0.0001) using a one way ANOVA with Dunnet’s post-hoc test for multiple comparison. Scale bar: 25 μm. |
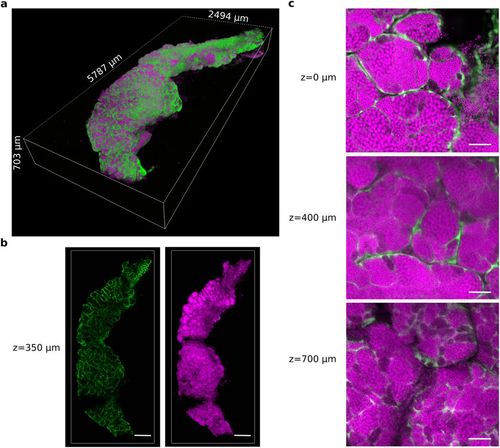
A testis was dissected from the zebrafish transgenic line Tg(gsdf:GFP) and cleared with the CUBIC protocol. All nuclei are in magenta (propidum iodide). The somatic Sertoli cells are in green (endogenous GFP fluorescence). (a) 3D rendering of the whole CUBIC-cleared testis. (b) 2D optical sections of the testis at 350 μm in depth. (c) Magnified view of 2D optical sections at 0 μm, 400 μm and 700 μm in depth. Images were acquired in 8 bits at a scanning speed of 600 Hz and at a resolution of 512 × 512 pixels with two lines average. Scale bars: 500 μm (b) and 50 μm (c). |
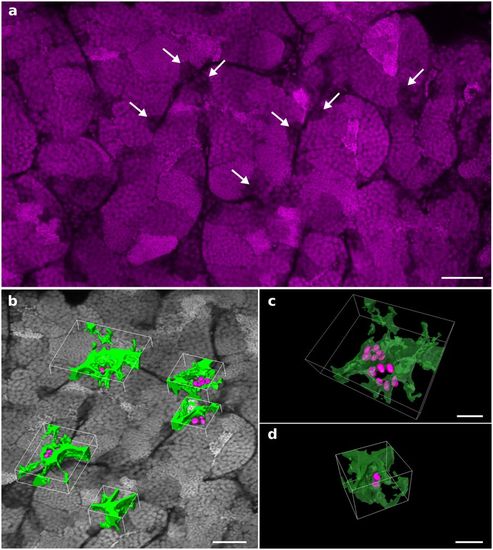
The testis dissected from a Tg(gsdf:GFP) transgenic line was stained with propidium iodide and cleared with the PACT protocol. Imaging and 3D reconstruction of the whole testis were performed as shown in Supplementary Fig. S5 and Supplementary Videos S6 and S7. (a) A 2D optical section at 237 μm in depth. Nuclei of undifferentiated spermatogonia are identified through the testis by their larger volume and low fluorescence intensity (arrows). (b) Examples of 3D surface reconstructions of germinal niches containing clustered undifferentiated spermatogonia. (c) High magnification view of two nearby niches located in adjacent seminiferous tubules and displaying six nuclei each. (d) High magnification view of a niche displaying two nuclei of undifferentiated spermatogonia. Nuclei are in grayscale or magenta. Surface reconstructed Sertoli cells and nuclei of undifferentiated spermatogonia are in green and magenta, respectively. Scale bars: 50 μm (a,b) and 20 μm (c). |
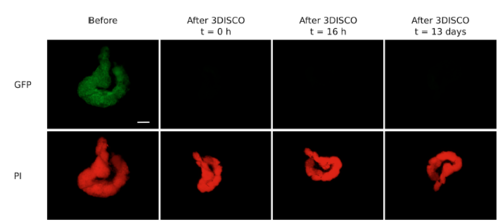
Fluorescence preservation within testis after 3DISCO clearing. The testis was dissected from the zebrafish transgenic line Tg(gsdf:GFP), stained with propidium iodide and cleared by using 3DISCO. Fluorescence of GFP and propidium iodide were both acquired before and after clearing at different time points. t = 0 h corresponds to the end of the last step of the protocol (15 minutes in DBE). Scale bar : 500 μm. |
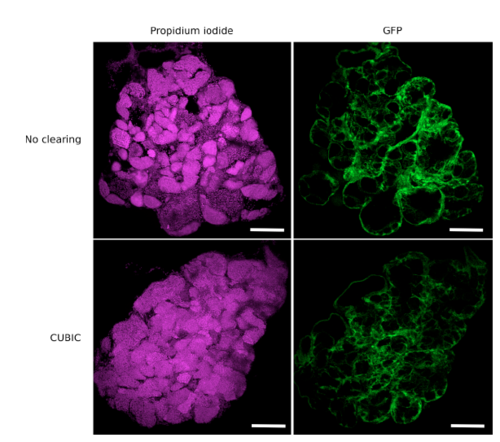
Confocal imaging of transverse vibratome sections of CUBIC-‐ cleared and uncleared testes. Testes were dissected from the zebrafish transgenic line Tg(gsdf:GFP), cleared or not with CUBIC and stained with propidium iodide. Transverse sections were performed with a vibratome to assess the nuclear staining in depth. Confocal images show that all nuclei in the center of the sample are efficiently stained. Images correspond to maximal projections of 10 optical slices (z-‐step = 3 μm). Nuclei are in magenta and Sertoli GFP cells in green. Scale bar: 100 μm. |
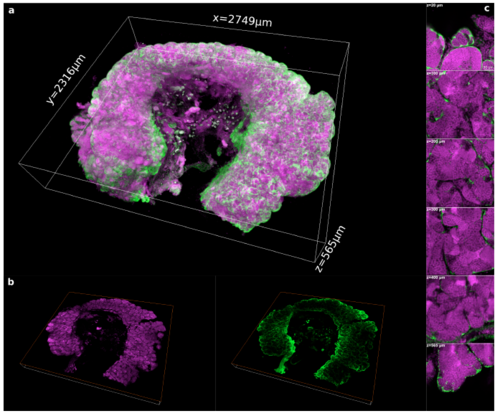
3D reconstruction of a whole portion of a testis cleared by the PACT method. (a) 3D rendering of a whole portion of a testis dissected from the transgenic line Tg(gsdf:GFP) and cleared by the PACT method. (b) 2D optical section of the whole testis at 350 μm in depth. (c) Magnified view on 2D optical sections at 20 μm, 100 μm, 200 μm, 300 μm, 400 μm and 565 μm in depth respectively. We acquired a total volume of 2.749 mm x 2.316 mm x 0.565 mm. The imaging of the whole testis took 7.5 h in our conditions and generated 28 GB of data. Images were acquired in 12 bits at a scanning speed of 600 Hz and a resolution of 512 x 512 pixels with two lines average. Voxel size: 0.865 μm x 0.865 μm x 1 μm. Nuclei are in magenta and Sertoli cells in green. Scale bar in (c) : 30 μm. |