
FIGURE
Fig. 4
Fig. 4
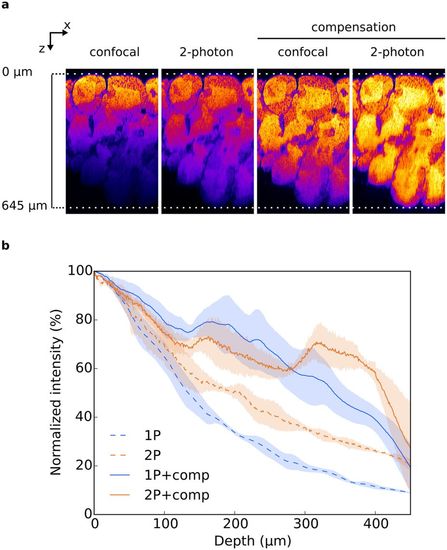
(a) XZ planes of testis treated with CUBIC and acquired either by confocal or 2-photon microscopy, with or without laser compensation. No brightness and contrast enhancement was applied. Nuclei were stained with propidium iodide and pseudocolored. (b) Fluorescence intensity quantification. Mean fluorescence intensity was normalized and plotted against the imaging depth. All data are mean ± SEM of 3 ROI acquired on 1 testis. |
Expression Data
Expression Detail
Antibody Labeling
Phenotype Data
Phenotype Detail
Acknowledgments
This image is the copyrighted work of the attributed author or publisher, and
ZFIN has permission only to display this image to its users.
Additional permissions should be obtained from the applicable author or publisher of the image.
Full text @ Sci. Rep.